Fig. 4.
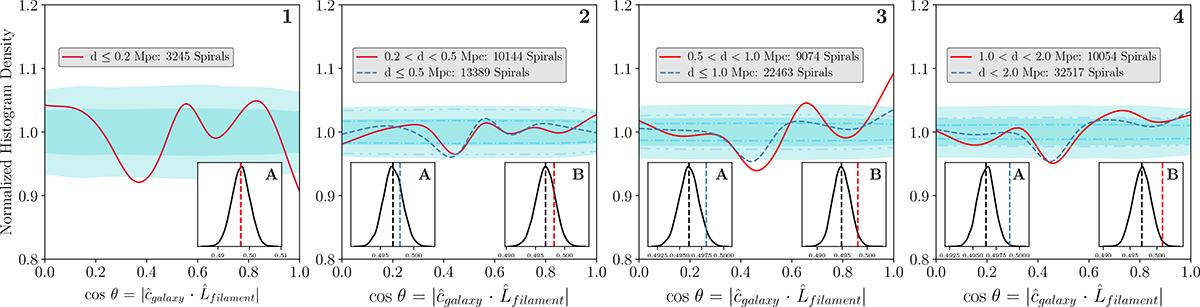
Download original image
Alignment signal – probability density distribution (PDF) of the cosines of the angle between spines of the filaments and the spin axes of spiral galaxies at different intervals of (< 0.2 Mpc), (0.2–0.5 Mpc), (0.5–1 Mpc), and (1–2 Mpc, in red). The dark cyan band shows the 1σ null hypothesis corridor beyond which the PDF is considered significant. The 2σ band (light cyan) is also provided as a visual comparison for the significance of the PDF. For comparison, the cumulative version for the distance bins (i.e. PDF for all the spiral galaxies that are within the distance range of the upper bound of the distance bin) is superimposed (in dashed blue lines) over the PDF for a given distance interval bin along with their error corridors (in dash-dotted blue lines). Inset plots depicting the mean of the alignment signal (red line: for differential subsets and blue line: for cumulative subsets) along with the distribution of the mean from the null hypothesis cases are inserted to visualize how much further the mean of the alignment signal is from the median of the distribution of the mean from the null hypothesis cases (black line), in terms of the standard deviation of the distribution. The statistical significance of the alignment in each subset is quantified and presented in Table 1 (Note: the alignment signal are normalized with the mean random signal so that the distributions are based around 1.0 for better inference of the alignment signal, and not under the assumption of null hypothesis to be an uniform distribution (refer Fig. 3)).
Current usage metrics show cumulative count of Article Views (full-text article views including HTML views, PDF and ePub downloads, according to the available data) and Abstracts Views on Vision4Press platform.
Data correspond to usage on the plateform after 2015. The current usage metrics is available 48-96 hours after online publication and is updated daily on week days.
Initial download of the metrics may take a while.