Fig. 7.
Download original image
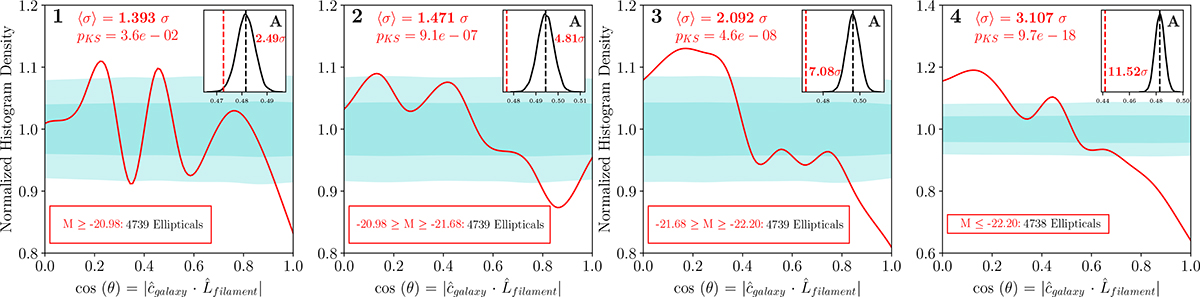
Normalized histogram of the alignment between elliptical galaxy spins and cosmic filaments, based on different luminosity bins. Each panel represents the distribution of the alignment signal (cos (θ)) for elliptical galaxies with absolute magnitudes in the following ranges: (a) −20.98 ≤ M (b) −21.68 ≤ M ≤ −20.98 (c) −22.20 ≤ M ≤ −21.68, and d) M ≤ −22.20. The alignment is quantified as the cosine of the angle between the galaxy spin vector and the filament axis. An inset plot depicting the mean of the alignment signal (red line) along with the distribution of the mean from the null hypothesis cases is inserted to visualize how much further the mean of the alignment signal is from the median of the distribution of the mean from the null hypothesis cases (black line), in terms of the standard deviation of the distribution. The statistical significance of alignment in each subset is quantified and presented in Table 2 (Note: the alignment signals are normalized with the mean random signal so that the distributions are based around 1.0 for better inference of the alignment signal, and not under the assumption of null hypothesis to be an uniform distribution (refer Fig. 3)).
Current usage metrics show cumulative count of Article Views (full-text article views including HTML views, PDF and ePub downloads, according to the available data) and Abstracts Views on Vision4Press platform.
Data correspond to usage on the plateform after 2015. The current usage metrics is available 48-96 hours after online publication and is updated daily on week days.
Initial download of the metrics may take a while.