Fig. 8.
Download original image
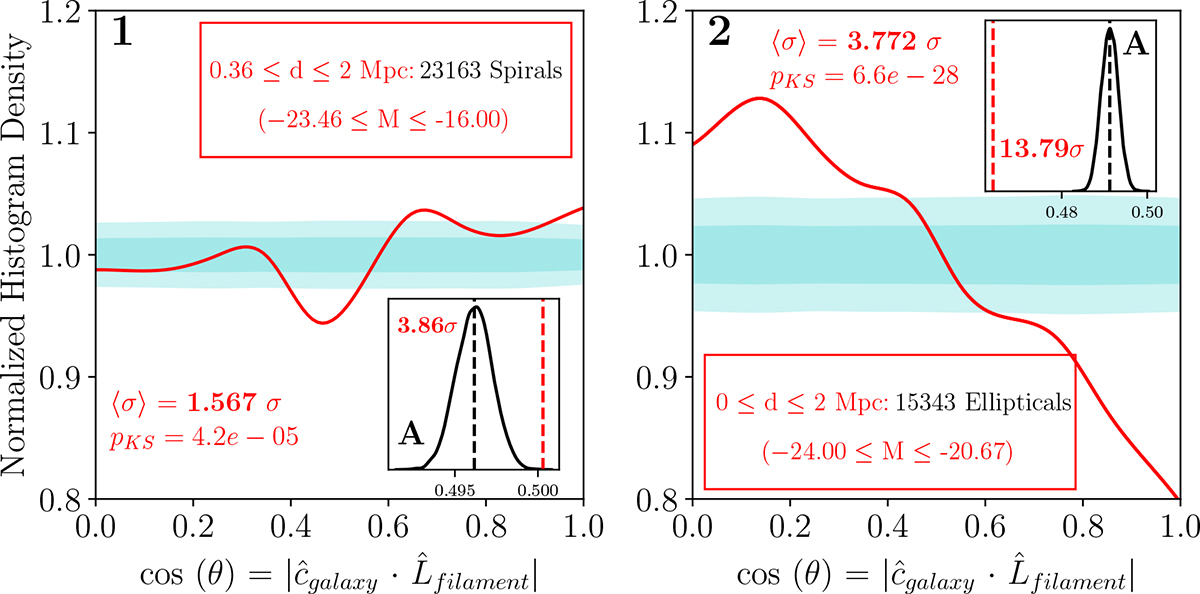
Normalized histogram of cosines of the angles between spines of the filaments and the spin axes of subset of spiral and elliptical galaxies with maximum significance. (![]() ). The dark cyan band represents the 1σ null hypothesis corridor, beyond which the probability density function is deemed significant, while the light cyan band provides a 2σ corridor as a visual comparison. An inset plot depicting the mean of the alignment signal (red line) along with the distribution of the mean from the null hypothesis cases is inserted to visualize how much is the mean of the alignment signal is further from the median of the distribution of the mean from the null hypothesis cases (black line), in terms of the standard deviation of the distribution. The statistical significance of alignment of these subset with maximum significance is quantified and presented in Table 3.
). The dark cyan band represents the 1σ null hypothesis corridor, beyond which the probability density function is deemed significant, while the light cyan band provides a 2σ corridor as a visual comparison. An inset plot depicting the mean of the alignment signal (red line) along with the distribution of the mean from the null hypothesis cases is inserted to visualize how much is the mean of the alignment signal is further from the median of the distribution of the mean from the null hypothesis cases (black line), in terms of the standard deviation of the distribution. The statistical significance of alignment of these subset with maximum significance is quantified and presented in Table 3.
Current usage metrics show cumulative count of Article Views (full-text article views including HTML views, PDF and ePub downloads, according to the available data) and Abstracts Views on Vision4Press platform.
Data correspond to usage on the plateform after 2015. The current usage metrics is available 48-96 hours after online publication and is updated daily on week days.
Initial download of the metrics may take a while.