Fig. 1
Download original image
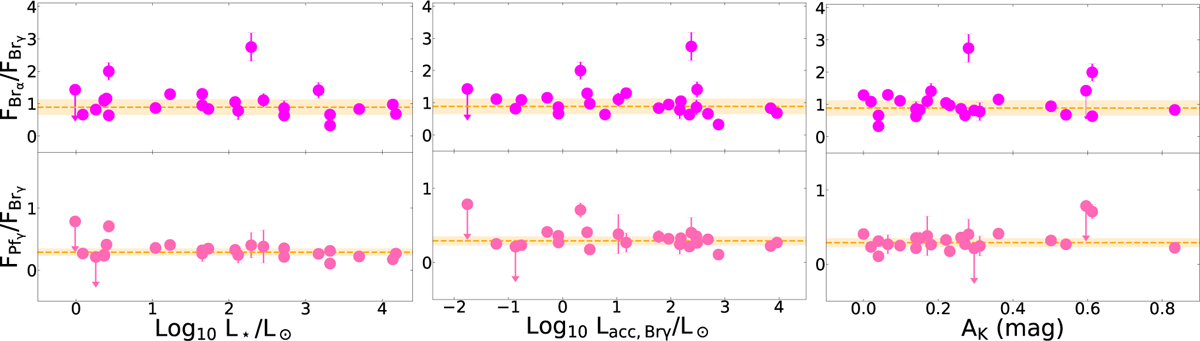
Top panel: ratio of the de-reddened Brα and Brγ fluxes of Class II sources shown as a function of L★ (left), Lacc, computed from the Brγ luminosity (center; see Sect. 3.3), and the extinction in the K band (right). Bottom panel: same but for the ratio of Pfγ to Brγ fluxes. The values of the ratios are shown by filled dots; the 3σ upper limits are indicated by arrows. When not visible, the errors are smaller than the dots. In both sets of panels, the mean values of the ratios and their uncertainties are shown in orange.
Current usage metrics show cumulative count of Article Views (full-text article views including HTML views, PDF and ePub downloads, according to the available data) and Abstracts Views on Vision4Press platform.
Data correspond to usage on the plateform after 2015. The current usage metrics is available 48-96 hours after online publication and is updated daily on week days.
Initial download of the metrics may take a while.