Fig. B.1
Download original image
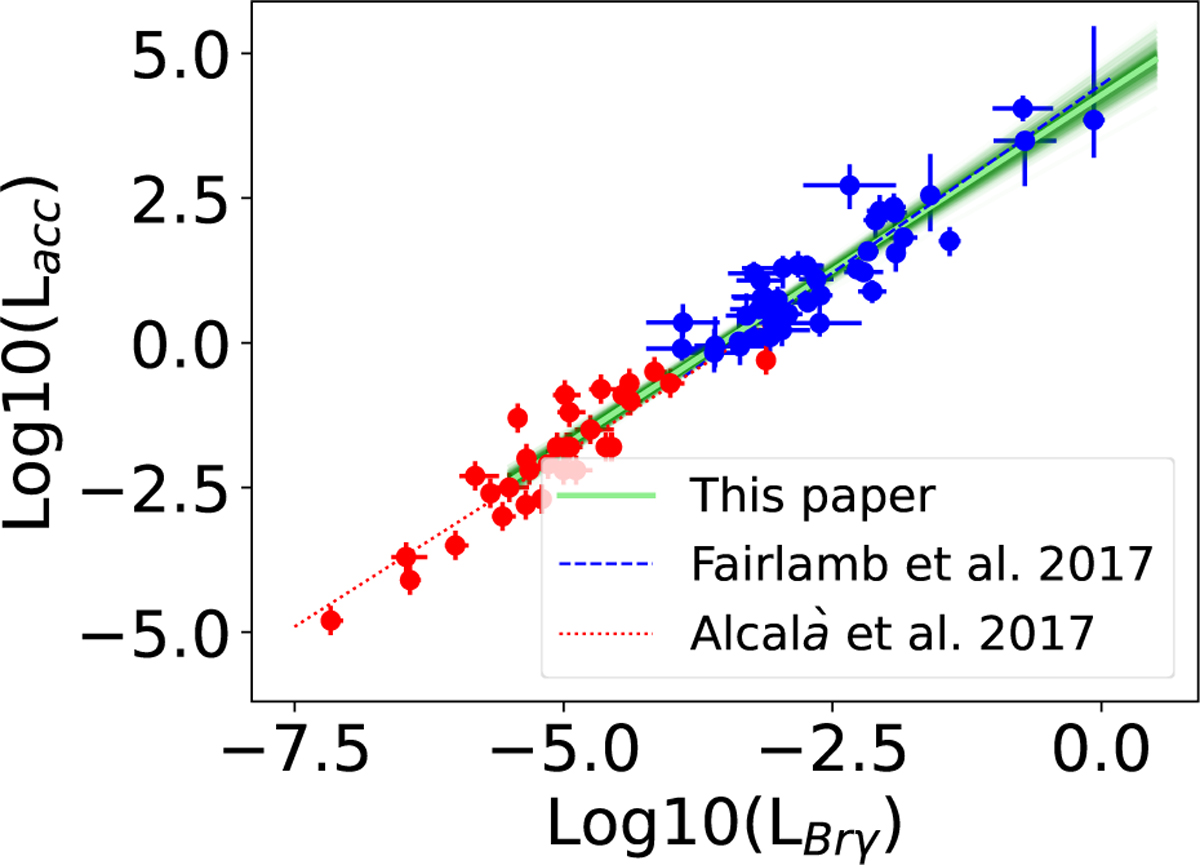
Correlation of Lacc-LBrγ for Class II objects in the literature. In red we show measurements for stars below about one solar mass (from Alcalá et al. 2017), in blue for intermediate mass stars (from Fairlamb et al. 2017). The red dotted line and blue dashed lines show the literature correlations, derived for each sample separately. The light green line shows the correlation we derive for the range −5.5 ≤ (LBrγ/L⊙) ≤ 0.5. The dark green band shows the uncertainty in the fit.
Current usage metrics show cumulative count of Article Views (full-text article views including HTML views, PDF and ePub downloads, according to the available data) and Abstracts Views on Vision4Press platform.
Data correspond to usage on the plateform after 2015. The current usage metrics is available 48-96 hours after online publication and is updated daily on week days.
Initial download of the metrics may take a while.