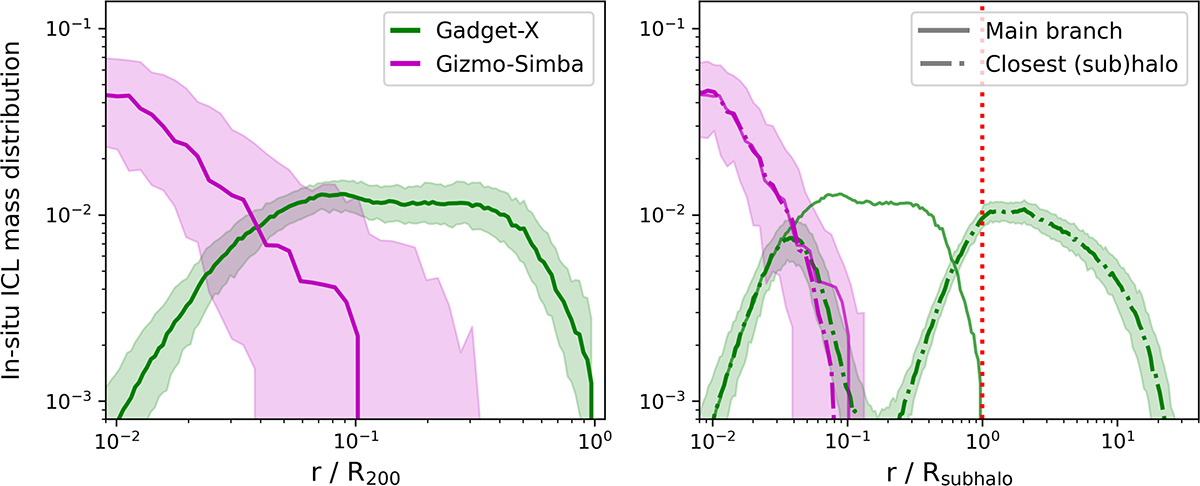
Fig. 3.
Download original image
Left: Distribution of distance from the in situ ICL particles to the main branch progenitor centre at the formation time of the particle, in units of the main branch halo radius R200. Green is for GADGET-X, magenta for GIZMO-SIMBA. Right: Distance from the in situ particles to the centre of the closest halo (or subhalo), in units of the radius of that halo, Rsubhalo. To ease comparison, we still show the distance to the main branch with the corresponding solid lines. The lines show the median computed stacking the 324 clusters; the shaded regions are the 16th–84th percentiles.
Current usage metrics show cumulative count of Article Views (full-text article views including HTML views, PDF and ePub downloads, according to the available data) and Abstracts Views on Vision4Press platform.
Data correspond to usage on the plateform after 2015. The current usage metrics is available 48-96 hours after online publication and is updated daily on week days.
Initial download of the metrics may take a while.