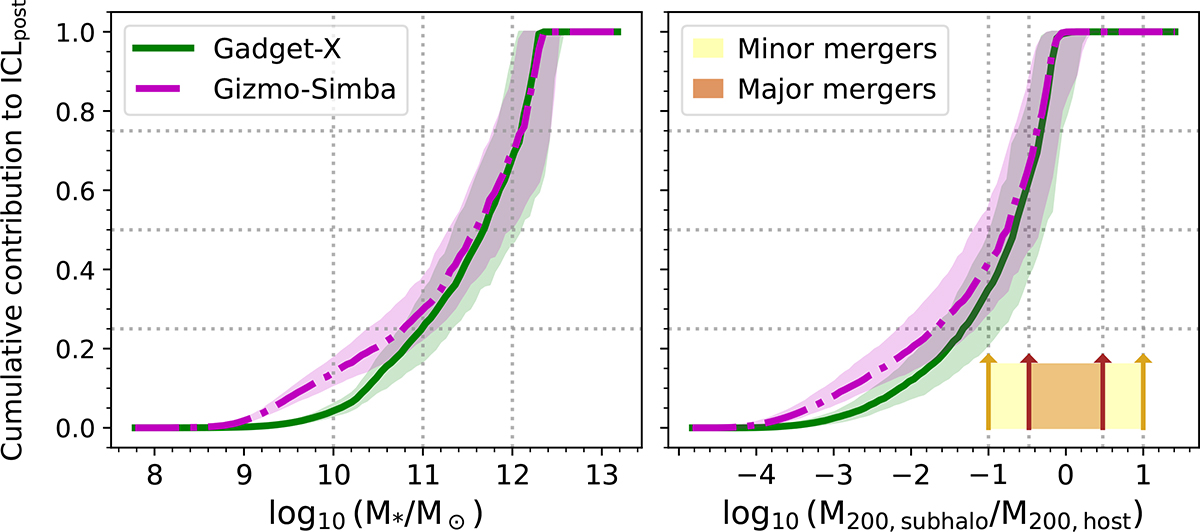
Fig. 5.
Download original image
Cumulative distribution of the mass contribution to the post-stripped ICL from halos of different infall masses. The left column is for stellar mass at infall; the right column is for the total mass ratio to the host at infall time. The lines depict the distributions obtained as the median of the individual distributions for each cluster, while the shaded regions indicate the 16th–84th percentiles. The green solid lines are for GADGET-X and the magenta dash-dotted lines for GIZMO-SIMBA. In the right column, the yellow and brown shaded regions indicate the minor (1:10 to 1:3) and major merger regimes (1:3 to 1:1). The horizontal dotted lines indicate fractions of 0.25, 0.5, and 0.75 of the post-stripped ICL.
Current usage metrics show cumulative count of Article Views (full-text article views including HTML views, PDF and ePub downloads, according to the available data) and Abstracts Views on Vision4Press platform.
Data correspond to usage on the plateform after 2015. The current usage metrics is available 48-96 hours after online publication and is updated daily on week days.
Initial download of the metrics may take a while.