Open Access
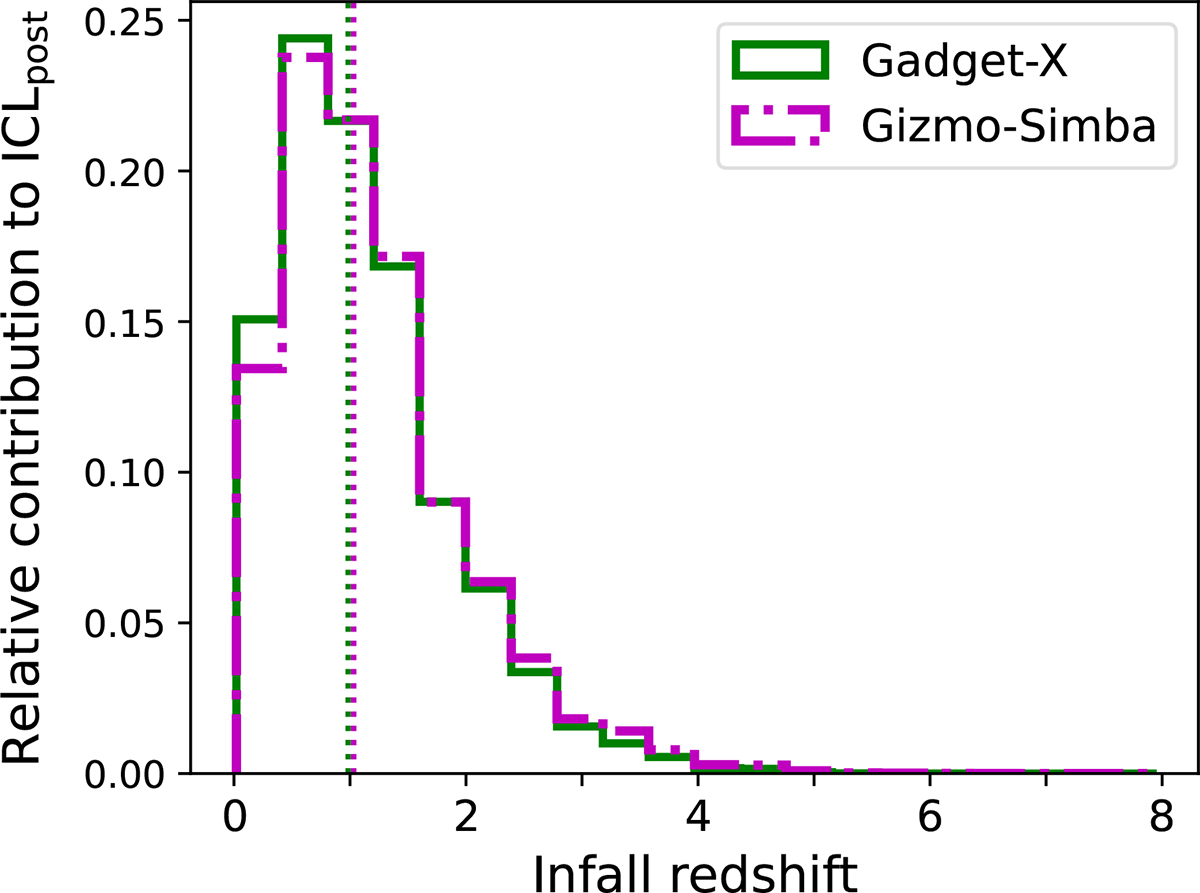
Fig. 6.
Download original image
Distribution of the relative mass contribution to the post-stripped ICL from halos with different infall times. The values for the 324 clusters have been stacked together to produce the distributions for GADGET-X (green) and GIZMO-SIMBA (magenta). The vertical dotted lines indicate the median values of each distribution.
Current usage metrics show cumulative count of Article Views (full-text article views including HTML views, PDF and ePub downloads, according to the available data) and Abstracts Views on Vision4Press platform.
Data correspond to usage on the plateform after 2015. The current usage metrics is available 48-96 hours after online publication and is updated daily on week days.
Initial download of the metrics may take a while.