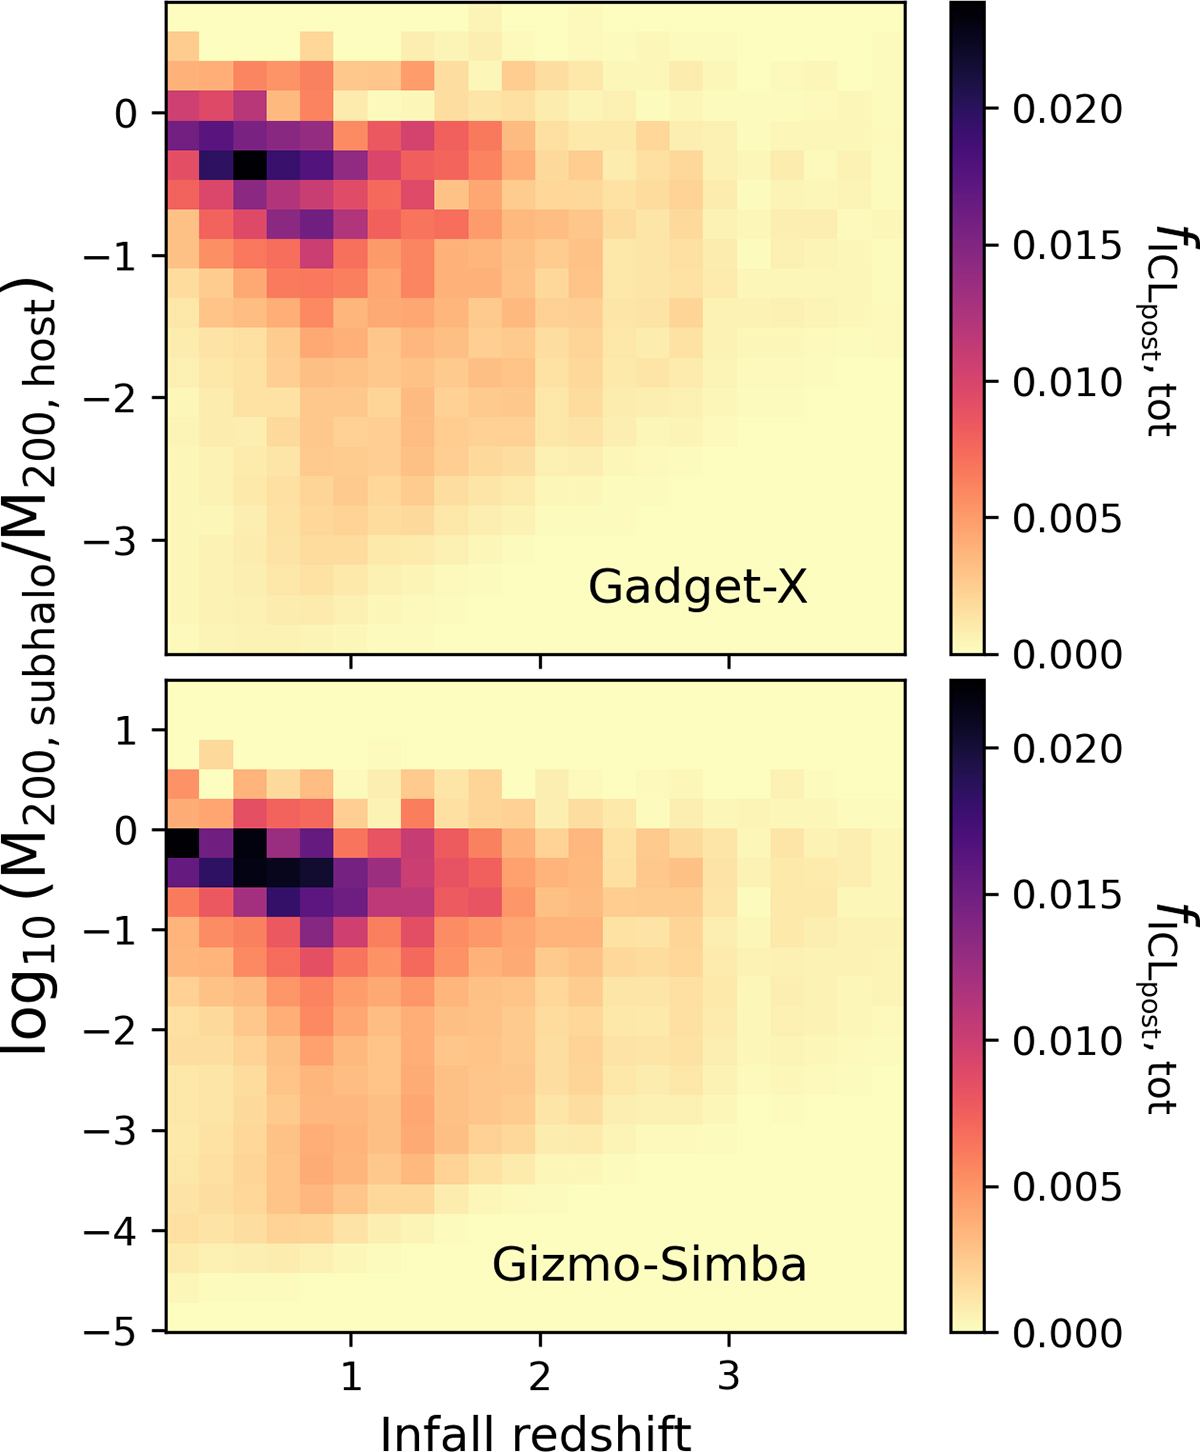
Fig. 9.
Download original image
Similar to Fig. 8, 2D histogram showing the distribution of the accreted halos that build the ICLpost (top for GADGET-X; bottom for GIZMO-SIMBA). Here the colouring is weighted by the fraction of mass that each halo contributes to the total ICLpost summed across all clusters. The x-axis shows the mass ratio of the halo to the host at infall, and the y-axis shows the corresponding infall redshift.
Current usage metrics show cumulative count of Article Views (full-text article views including HTML views, PDF and ePub downloads, according to the available data) and Abstracts Views on Vision4Press platform.
Data correspond to usage on the plateform after 2015. The current usage metrics is available 48-96 hours after online publication and is updated daily on week days.
Initial download of the metrics may take a while.