Fig. 3
Download original image
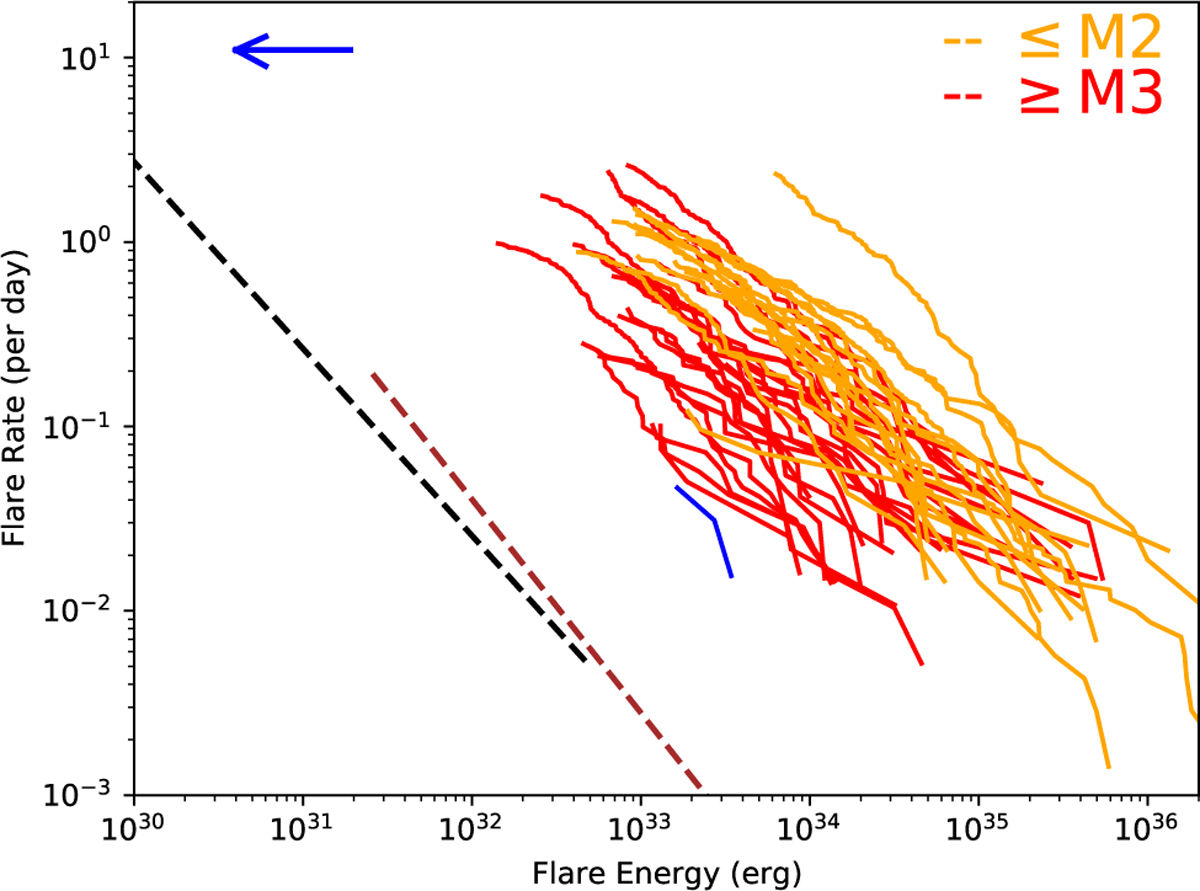
Bolometric flare frequency distribution of LP 89-187 as derived from three sectors of TESS data shown in blue. The blue arrow indicates the upper limit derived from the HiPERCAM observations. We show the bolometric flare frequency distribution of stars in the β Pic moving group in orange (spectral type ≲ M2) and in red (spectral type ≳ M3). We also show the flare frequency distribution of TRAPPIST-1 analogue stars (dashed black line) and TRAPPIST-1 using K2 data (dashed brown line) taken from Fig. 21 of Seli et al. (2021).
Current usage metrics show cumulative count of Article Views (full-text article views including HTML views, PDF and ePub downloads, according to the available data) and Abstracts Views on Vision4Press platform.
Data correspond to usage on the plateform after 2015. The current usage metrics is available 48-96 hours after online publication and is updated daily on week days.
Initial download of the metrics may take a while.