| Issue |
A&A
Volume 703, November 2025
|
|
|---|---|---|
| Article Number | A122 | |
| Number of page(s) | 6 | |
| Section | Stellar atmospheres | |
| DOI | https://doi.org/10.1051/0004-6361/202554275 | |
| Published online | 10 November 2025 | |
HiPERCAM and TESS observations of the rapidly rotating M7V star LP 89–187
1
Armagh Observatory and Planetarium,
College Hill,
Armagh,
BT61 9DG,
N. Ireland,
UK
2
Astrophysics Research Cluster, School of Mathematical and Physical Sciences, University of Sheffield,
Sheffield
S3 7RH,
UK
3
Instituto de Astrofísica de Canarias,
38205
La Laguna,
Tenerife,
Spain
4
GRANTECAN,
Cuesta de San José s/n,
38712,
Breña Baja,
La Palma,
Spain
★ Corresponding author: This email address is being protected from spambots. You need JavaScript enabled to view it.
Received:
26
February
2025
Accepted:
18
September
2025
Abstract
The discovery of a significant number of rapidly rotating low-mass stars showing no or few flares in TESS observations was a surprise, as rapid rotation has previously been linked to high stellar activity. Here we present TESS and HiPERCAM usgsrsiszs observations of one of these stars, LP 89-187, which has a rotation period of 0.117 d. TESS data covering three sectors (64.6 d) only show three flares, which have energies of a few times 1033 erg, whilst HiPERCAM observations, which cover 0.78 of the rotation period, show no evidence of flares more energetic than approximately 1031 erg. Intriguingly, other surveys show that LP 89-187 has a weak Hα emission. We compared the flare energy distribution of LP 89-187 with low-mass stars in the β Pic moving group, which have an age of approximately 24 Myr. We find that LP 89-187 has a lower flare rate than the β Pic stars. In addition, we find that TRAPPIST-1 analogue stars, which likely are significantly older than the β Pic stars, show fewer flares with energies greater than 1033 erg in TESS data. We examined the relationship between amplitude and period for a sample of low-mass stars and find that more rapid rotators have a higher amplitude.
Key words: magnetic fields / stars: activity / stars: flare / stars: low-mass / stars: rotation
© The Authors 2025
 Open Access article, published by EDP Sciences, under the terms of the Creative Commons Attribution License (https://creativecommons.org/licenses/by/4.0), which permits unrestricted use, distribution, and reproduction in any medium, provided the original work is properly cited.
This article is published in open access under the Subscribe to Open model. This email address is being protected from spambots. You need JavaScript enabled to view it. to support open access publication.
1 Introduction
It is well known that as stars age, their rotation period declines (Skumanich 1972). Over the last few decades, it has also become clear that as stars age, they also become less ‘active’ (see Davenport et al. 2019). Stellar activity can manifest itself in different ways: for example, as starspots, narrow optical line emission, X-ray emission, and through flare activity. Although flares have been observed on stars with early spectral types, they appear more common on low-mass dwarf stars and fully convective stars (later than M3/4V) in particular (Pettersen 1989).
The launch of TESS in April 2018 allowed nearly monthlong photometric observations with a 2 min cadence for tens of thousands of stars (Ricker et al. 2015). Data from the first three months of the mission revealed a sample of low-mass stars (M0-M6V) exhibiting a modulation on a period of less than 1 d (Doyle et al. 2019). These ultra-fast rotators (UFRs) are amongst the very fastest rotating main-sequence stars. Surprisingly, UFRs with periods less than 0.3 d showed no or few flares in their light curves. Günther et al. (2020), who used data taken from the first two months of the mission, also found a tentative decrease in the flare rate for stars with P<0.3 d. Given that fast rotation is generally taken to imply a strong magnetic field through the dynamo effect (e.g. Hartmann & Noyes 1987), these findings were unexpected.
A systematic search for UFRs using all the southern ecliptic 2 min cadence TESS data was reported by Ramsay et al. (2020). Out of 9887 stars with T<14 mag (the TESS passband, ~600-1000 nm) and close to the main sequence, 609 were found to be low-mass stars with a period of less than 1 day. Out of these, only 288 showed at least one flare. For stars with periods greater than 0.4 d, 51% of the stars are flare active, whilst for the stars with periods less than 0.2 d, the fraction is 11%. This supports the findings of Doyle et al. (2019) and Günther et al. (2020).
Several studies have attempted to address why some UFRs show very low flare activity. Doyle et al. (2022) used the ESO Very Large Telescope to make spectropolarimetric observations of ten UFRs and found that five have a magnetic field around 1-2 kG (this is typical of low-mass stars; Reiners et al. 2022). It is therefore unlikely that the star’s low flare activity is caused by a low magnetic field strength. In another study, Ramsay et al. (2022) used spectroscopic observations from the Nordic Optical Telescope (NOT) to determine if UFRs showing no flare activity were in binary systems. They found that out of 29 targets whose spectra were obtained over three nights, only one showed evidence of clear radial-velocity variations, indicating that most showed no evidence of being in binary systems.
Another possibility, investigated by Doyle et al. (2022) and Ramsay et al. (2022), is related to an effect called supersaturation (e.g. Jeffries et al. 2011), where magnetic field lines are not able to reconnect since they extend beyond the stellar corona due to centrifugal stripping as the Keplerian corotation radius moves inside the X-ray emitting coronal volume. An alternative solution could be: (i) flares on these stars are numerous but have low energy and therefore cannot be observed in the TESS passband, or (ii) the flares could be explained via radiative transfer studies such as Houdebine et al (1996). The latter showed that at very high transition region pressures, corresponding to active dMe atmospheres, the chromosphere becomes a very efficient radiator at continuum wavelengths, particularly in the UV and/or blue region. This is similar to what we see in the blue continuum of intense solar flares, except that in super-saturated M dwarfs, a large fraction of the stellar chromosphere experiences intense heating deep in the atmosphere due to the high pressure in the transition region. In contrast, in the solar case, only the flare kernels (i.e. the location in the chromosphere where we see flare emission) are enhanced. Based on older 1D models, the flare kernel was assumed to be caused by electron beams, while newer 3D models (Druett et al. 2024) do not require beams, either electrons or ions. Both possibilities can be investigated by looking for flux variability.
In this paper, we report on a search for short-duration or low-energy flares using HiPERCAM from one rapidly rotating star, LP 89-187, which showed no flares in the first sector of TESS data. We also constrained the rate of higher-energy flares using an additional two sectors of TESS data.
Key parameters of LP 89-187, as determined by Gaia (Gaia Collaboration 2021).
2 LP 89-187
LP 89-187 is included in the Luyten (1979) catalogue of high proper motion stars. Subsequently, Gaia data (Gaia Collaboration 2021) indicated it at a distance of 22.9 pc (see Table 1 for the key Gaia parameters). Using MEarth photometric observations, Newton et al. (2016) found a short-period modulation (0.117 d). LP 89-187 (TIC 80859893) was first observed in TESS Sector 20 in the 2 min cadence mode. These observations confirmed the short-period modulation (0.1165 d). In addition, this sector of data showed no evidence for optical flares. However, García Soto et al. (2023) obtained three spectra of LP 89-187 during a survey of low-mass stars and determined an Hα Equivalent Width of −5.25 Â, indicating at least some evidence of activity. Using LAMOST spectra, Wang et al. (2022) determined a spectral type of M7, implying LP 89-187 is fully convective (no evidence of Lithium was found in the spectrum).
We conclude that the photometric modulation is the signature of the rotational period of the star for the following reasons: with a Gaia Re-normalised unit weight error (RUWE) value of 0.958 (Table 1), the star is not likely to be in a binary system with a much more massive component (Castro-Ginard et al. 2024). The v sin i value of 66.0±0.5 km s−1 (García Soto et al. 2023) is entirely consistent with a rapidly rotating star, and the phase-folded TESS light curves (Sect. 5) are consistent with a star exhibiting spots, but not with binary systems, which show ellipsoidal modulation. Although we can expect some variation in a star’s photometric period over time due to spot migration, the spread in the period of LP 89-187 derived from the three TESS sectors is very low (see Ramsay et al. 2024 who show that low-mass and solar-type stars can exhibit a very large spread in the period derived from many TESS sectors, likely because the detected period is not the true signature of the rotation period). In the unlikely event that the period of LP 89-187 was not the signature of the rotation period but rather a binary orbital period, then we would still expect the component stars in binaries with periods shorter than approximately 4 d to be synchronised with the orbital period (Lurie et al. 2017; Fleming et al. 2019). Based on these characteristics, we decided to observe LP 89-187 using the high-speed imager HiPERCAM.
3 Observations
HiPERCAM is a multi-band optical imager mounted on the 10.4 m Gran Telescopio Canarias (GTC) on La Palma. It obtains simultaneous images in five bands (usgsrsisZs) and can be read out at rates faster than 1 kHz (see Dhillon et al. 2021 for details of HiPERCAM).
Observations of LP 89-187 were performed using the GTC and HiPERCAM on 10 February 2024. The conditions were generally clear (although there were some thin clouds at times). The mean seeing was approximately 1.2" (although occasionally it got significantly worse, rising to over 4″), and lunar conditions were dark. Images were obtained every 0.74 s in all five filters, with only 8 msec deadtime between exposures. Two comparison stars were visible in the field of view. The duration of the observations covered 2.18 h, or 0.78 of the rotation period of LP 89-187.
The data were reduced using the HiPERCAM data reduction pipeline (Dhillon et al. 2021). Prior to aperture photometry, images were de-biased and flat-fielded, whilst is and zs images also had fringe corrections applied. Aperture photometry of LP 89-187 was carried out with apertures that varied with the measured full width at half maximum in each frame to minimise the effects of seeing variations on the photometry. The measured counts of LP 89-187 were divided by the mean counts of the two reference stars to remove any transparency variations. There is a large difference in colour between LP 89-187 and the comparison stars. Secondary extinction effects make the long-term trend in the light curve unreliable and prevent the detection of the rotation signature. However, they do not affect the photometry on short timescales and did not hamper our ability to detect flares.
We show the light curve in the gsrsiszs bands in Fig. 1: no stellar sources were detected in any of the us band images. The light curves show some residual features, which were caused by poorer conditions. There was no visual evidence of any flares in any of the passbands. To conduct a more detailed search for flares, we used Altaipony (Davenport 2016; Ilin et al. 2021). For a feature to be classed as a flare, three or more consecutive flagged points were required. We did not find any flares in the gsrsiszs images.
To estimate the luminosity of flares, which we could have detected, we again used Altaipony to inject simulated flares with profiles typical of stellar flares. For each gsrsiszs light curve, we created 500 simulated light curves and injected flares with amplitudes ranging from 10−8−0.1 (i.e. a maximum of 10 percent above the mean) and had durations ranging from 0.7-30 min. We then searched for flares in these simulated light curves.
To determine the energy of these simulated flares, we first obtained the quiescent bolometric luminosity of LP 89-187 from the TIC V8.2 catalogue, L=0.00121 L⊙ (Paegert et al. 2021). We calculated the flare energy using
 (1)
(1)
where E is the flare energy, Lquiet is the quiescent luminosity of the star, and ED is the equivalent duration of the flare (Gershberg 1972) determined using Altaipony.
However, given that the temperature of flares is hotter than the photosphere of an M7V star (~2700 K), we accounted for the fact that much of the flux would lie outside the HiPERCAM passbands. Inevitably, there was uncertainty in the best choice of temperature, with Howard et al. (2019) assuming 9000 K, while Jackman (2022) finding evidence for a temperature of approximately 6000 K. We assumed a flare temperature of 6000 K. (To convert the resulting flare energies assuming a flare temperature of 9000 K, we multiply these energies by a factor of 0.9, 1.3, 1.6, and 1.9 for gsrsiszs, respectively.) To determine a correction factor for the bolometric flux for each passband, we convolved the passband of the HiPERCAM filters with the blackbody (also an approximation) of 6000 K to obtain the correction factors −15.4, 17.2, 24.6, and 49.7 for gsrsiszs, respectively. The minimum energy for the simulated flares in each passband ranged from 1.9×1031 to 5.2×1031 erg.
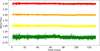 |
Fig. 1 Differential photometry of LP 89-187 obtained using HiPERCAM, with gs (colour-coded green), rs (yellow), is (orange), and zs (red) shown from the bottom to top. The differential flux for each 0.74 s exposure is normalised by dividing by the mean in each band, and each subsequent filter has been shifted vertically by 0.5. Time zero corresponds to MJD=60 350.902. The residual features, including the flare-like features in the gs band, are due to poorer conditions. The signature of the star’s rotation has largely been removed due to the large colour difference between the target and the two comparison stars. |
4 Further TESS observations
Over the course of our analysis of low-mass stars observed using TESS, we initially identified LP 89-187 as a rapidly rotating late-type star, which showed no optical flares in the 2 min cadence data obtained in Sector 20. Since then, it has also been observed in Sectors 47 and 60, again with 2 min cadence. We subsequently searched the more recent data for flares.
For each sector of data, we first removed data points that did not have QUALITY==0 flags and then removed the signature of the rotation period using kepflatten, which is part of the PyKE suite of tools1. To search for and characterise flares, we again used Altaipony (Davenport 2016; Ilin et al. 2021), where we required three or more consecutive points to be flagged for a flare to be classed. This inevitably implies that we could not detect flares with durations shorter than a few minutes. There were two consecutive events above the local mean in sector 47, which might have been a short duration flare although this could have been due to noise. We note that from TESS Cycle 5, there was the possibility of obtaining data with a 20 sec cadence. We identified three flares and show their profiles in Fig. 2. Each flare shows the typical stellar flare profile: a rapid rise followed by a slower decline. The first flare had a duration of approximately 20 min, while the other two had a duration of approximately 10 min.
To determine the energies of the flares, we used the same procedure as for the simulated flares (see Sect. 3 and also Ramsay et al. 2020; Ramsay et al. 2021) and used a correction factor of 3.1 for the TESS filter where we assumed a flare temperature of 6000 K. We estimate the energies of the flares to be 3.3, 2.7, and 1.6×1033 erg (left to right, repectively, in Fig. 2). (In the unlikely event of LP 89-187 being a component of a binary system (see Sect. 2), then these energies would be reduced by a factor of 2 if the companion was, for instance, an M7V star). The total duration of the observations was 64.6 d. Therefore a flare with energy of a few times 1033 erg occurred once every 21.5 d, or at a rate of 0.0465 d−1.
5 Discussion
We identified LP 89-187 as a low-mass star that rotates very fast (0.117 d) but showed no evidence of optical flares during its first sector of TESS observations. Given that we usually expect such rapid rotators to be active due to the dynamo effect, this is a surprise. To investigate this further, we examined additional TESS data and obtained a short amount of high-cadence photometry using HiPERCAM mounted on the GTC.
LP 89-187 was observed in three TESS sectors giving data covering 64.6 d. We detected three flares, all with energies greater than 1033 erg. This implies a flare once every 21.5 d or with a frequency of 0.0465 d−1. We show the flare frequency distribution using the TESS data and the upper limit derived from the HiPERCAM data in Fig. 3. To place these flare frequency distributions in the wider context, we sought out a suitable sample of stars to compare.
Determining robust ages for M dwarfs is difficult (see Soderblom (2010) for details). However, stars in open clusters or moving groups are particularly useful, since the cluster age can be determined. One group of stars, which has been studied by TESS, is that in the β Pic moving group, which has an age of 24±3 Myr (Ealy et al. 2024). Although LP 89-187 has a proper motion, which is not consistent with that of this moving group, given its rapid rotation it is likely to be a very young star. (Lu et al. (2024) determine a gyrochronology relationship for partially and fully convective stars, but this is not calibrated for stars younger than 0.67 Gyr). However, given the absence of lithium in its spectrum (Wang et al. 2022), it is unlikely to be much younger than the β Pic group (see Gutiérrez Albarrán et al. 2024 for a recent study on the lithium age relation). There is some evidence that fully convective dwarfs can remain fast rotators for several gigayears, but slow down quickly (Newton et al. 2016). However, Pass et al. (2022) found a small number of low-mass stars that appear to have spun down substantially by 600 My due to the nature of the stars’ magnetic field.
To ensure a like-for-like comparison, we downloaded all of the available TESS data of the 49 stars analysed by Ealy et al. (2024). Some of these stars have been observed in multiple sectors, with the most recent being observed in Sector 71 (which ended in Nov. 2023). We again used Altaipony (Davenport 2016; Ilin et al. 2021) to identify flares in the TESS data, after removing the rotation signature and requiring at least three consecutive points to be part of a flare. Similarly, we assumed a temperature of 6000 K and applied a correction to obtain the flare bolometric luminosities. Of the 49 stars in the sample, seven did not have a luminosity listed in the TIC 8.2 catalogue (Paegert et al. 2021), four of whcih were classed as giant stars; we therefore did not determine the flare energies for these stars.
We show the flare frequency distribution of LP 89-187 and the 42 stars in the sample of Ealy et al. (2024) in Fig. 3. The flare distribution of LP 89-187 indicates fewer flares in the approximately 1033 erg range than those of the stars in the β Pic sample. The rotation period of these stars range from 0.20-8.74 d, implying that LP 89-187 rotates more rapidly than stars in the β Pic sample. We note that there is some evidence in Fig. 3 that stars with a spectral type ≳ M3 show fewer flares than stars with spectral type ≲ M2: this seems to be the reverse of the finding by Ealy et al. (2024). It is unclear why this is the case.
The HiPERCAM observations are relatively short (2.18 h) and do not fully cover the rotation period. However, there was no evidence of emission in the us band in any of the individual images. Furthermore, there was no evidence of flares in the gsrsiszs bands. By injecting simulated flares into these light curves, we are confident that we would have detected flares with energies greater than a few 1031 erg. If we extrapolate the flare frequency distribution of the stars in the β Pic sample to lower energies, we find that they are likely to have higher flare rates than that inferred for LP 89-187. Extrapolating a plausible flare frequency distribution of LP 89-187 down to 1031 erg, we estimate that the HiPERCAM observations provide an upper limit of 20 flares per day for energies greater than 1031 erg, corresponding to 1.8 flares during the HiPERCAM observations period.
We also compared these flare rates with stars that are close in the colour-absolute magnitude diagram to TRAPPIST-1, which is an M8V star hosting seven transiting exoplanets. Seli et al. (2021) analysed the TESS 30 min cadence data of 248 stars and identified 94 flares. The derived ages of the stars vary but exhibit a peak in their distribution at approximately 2 Gyr (the 1σ uncertainty ranges typically from 2-3 Gyr). In Fig. 3 we show the flare frequency distribution of TRAPPIST-1 and its ‘analogue’ stars obtained using K2 data (Fig. 21 in Seli et al. 2021). The stars in the young β Pic moving group and in LP 89-187 all show flares with energies of ≳ 1033 erg. (We reduced the energy of the flares in Seli et al. (2021) by 1.6, since they assumed a flare temperature of 9000 K rather than the 6000 K we assumed). In contrast, the TRAPPIST-1 analogue stars show flares with energies of ≳1033 erg at a rate which is approximately 2 orders of magnitude less than the β Pic stars - this is expected because of their difference in age.
We now compare the amplitude of the rotational modulation of LP 89-187 with other low-mass stars, where we determine the peak-to-peak amplitude of a Fourier series fit to the light curve at the dominant period (we use the Lomb Scargle periodogram, as implemented in the VARTOOLS software suite (Hartman et al. 2008). The average amplitude from three sectors is 1.655±0.102 %, and we show the phase-folded and binned light curves for the different sectors in Fig. 4.
We now compare the derived amplitude with other low-mass stars. In Ramsay et al. (2024), we examined TESS data of low-mass stars in both the northern and southern continuous viewing zones, implying that these stars were observed in multiple sectors. We identified a sample of stars with a very low spread in their derived period across different sectors. Stars with a higher spread in their period indicated that the observed period was not the signature of the rotation period. For those stars with a low spread in their period (where LP 89-187 lies), we show the amplitude of their rotation as a function of period in Fig. 5. There is a significant correlation (p=0.0016) between period and amplitude with a slope of −0.19±0.06. This suggests that the inhomogeneity of darker regions (magnetic activity) is greater for more rapidly rotating stars; this would again be at odds with the relatively low number of flares seen in LP 89-187.
We now briefly discuss one possible explanation for rapidly rotating low-mass stars exhibiting relatively low rates of optical flares. In the 1990s, the existence of polar spots was the subject of intense debate, as discussed by Schussler & Solanki (1992) and references therein. Further studies (e.g. Holzwarth 2007; Isik et al. 2024) suggested that high latitude spots on fast-rotating M dwarfs is due to the dominance of the Coriolis force. Spots at high latitude can interact with open field structures leading to increased stellar wind and reduced flare production. It is possible that these rapidly rotating young stars have a dominant spot location at high latitudes that leads to reduced flare activity. This is consistent with studies by Hallinan et al. (2007, 2008), who reported intense radio emission from the polar regions of a subset of rapidly rotating (a few hours) ultra-cool M dwarfs. This region is only visible on objects, whose axis is inclined towards Earth. The presence of such a region on UFRs can reduce the amount of free energy available for flares, leading to a lower rate of flare activity.
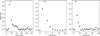 |
Fig. 2 Three flares detected in TESS observations of LP 89-187 using 2 min cadence data. The start time of each flare is, from left to right, MJD=59 581.12, 59 592.19 (both Sector 47), and 59 942.01 (Sector 60). |
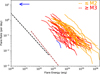 |
Fig. 3 Bolometric flare frequency distribution of LP 89-187 as derived from three sectors of TESS data shown in blue. The blue arrow indicates the upper limit derived from the HiPERCAM observations. We show the bolometric flare frequency distribution of stars in the β Pic moving group in orange (spectral type ≲ M2) and in red (spectral type ≳ M3). We also show the flare frequency distribution of TRAPPIST-1 analogue stars (dashed black line) and TRAPPIST-1 using K2 data (dashed brown line) taken from Fig. 21 of Seli et al. (2021). |
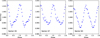 |
Fig. 4 Folded light curves of LP 89-187 across three TESS sectors. The phase has been shifted so that the flux maximum occurs at φ=0.0. |
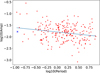 |
Fig. 5 Amplitude of the modulation versus period of stars taken from Ramsay et al. (2024) with a low spread in the period between TESS sectors (δLS < 0.05). LP 89-187 is shown as a blue cross; its slope has an index of −0.19 with a significance of p=0.0016. |
6 Conclusion
Observations with Kepler and TESS have revealed a subset of UFR (P < 0.3 d) M dwarfs characterized by reduced flare activity. One of these stars is LP 89-187, which has a 0.117 d rotation period. Observations by García Soto et al. (2023) show that the LP 89-187 has Hα emission at several epochs. We analysed three TESS sectors of data for LP 89-187 and detected three flares with energies of approximately 1033 erg. We also used HiPERCAM to monitor for optical flares at lower energies, failing to detect any flares over the course of the relatively short observation period. We also compared the flare rate of TRAPPIST-1 analogue stars, which have a similar spectral type to LP 89-187 but are older than the β Pic group of stars. We find that the young β Pic stars show flares with energies greater than 1033 erg at rates several orders of magnitude higher than those observed in older TRAPPIST-1 analogues. In contrast, LP 89187, whose age is uncertain but likely not younger than that of the β Pic stars, exhibits flares with energies of 1033 erg, but at a lower rate than the β Pic stars. Determining the age of LP 89-187 is of great interest, and this maybe possible if we could identify it as a members of a moving group of stars with a known age.
Acknowledgements
V.S.D. and HiPERCAM operations are funded by the Science and Technology Facilities Council (grant ST/Z000033/1). Based on observations made with the Gran Telescopio Canarias (GTC), installed at the Spanish Observatorio del Roque de los Muchachos of the Instituto de Astrofísica de Canarias, on the island of La Palma, under program ID GTC120-23B. The design and construction of HiPERCAM was funded by the European Research Council under the European Union’s Seventh Framework Programme (FP/2007-2013) under ERC-2013-ADG Grant Agreement no. 340040 (HiPERCAM). This paper also includes data collected by the TESS mission whose funding is provided by the NASA’s Science Mission Directorate. J.G.D. would like to thank the Lever-hulme Trust for a Emeritus Fellowship. Armagh Observatory & Planetarium is core funded by the N. Ireland Executive through the Dept. for Communities.
References
- Castro-Ginard, A., Penoyre, Z., Casey, A. R., et al. 2024, A&A, 688, A1 [NASA ADS] [CrossRef] [EDP Sciences] [Google Scholar]
- Davenport, J. R. A. 2016, ApJ, 829, 23 [Google Scholar]
- Davenport, J. R. A., Covey, K. R., Clarke, R. W., et al. 2019, ApJ, 871, 241 [Google Scholar]
- Dhillon, V. S., Kennedy, M. R., Kennedy, R. P., et al. 2021, MNRAS, 507, 350 [NASA ADS] [CrossRef] [Google Scholar]
- Doyle, L., Ramsay, G., Doyle, J. G., & Wu, K. 2019, MNRAS, 489, 437 [Google Scholar]
- Doyle, L., Bagnulo, S., Ramsay, G., Doyle, J. G., & Hakala, P. 2022, MNRAS, 512, 979 [NASA ADS] [CrossRef] [Google Scholar]
- Druett, M., Ruan, W., & Keppens, R. 2024, A&A, 684, A171 [NASA ADS] [CrossRef] [EDP Sciences] [Google Scholar]
- Ealy, J. N., Schlieder, J. E., Komacek, T. D., & Gilbert, E. A. 2024, AJ, 168, 173 [NASA ADS] [CrossRef] [Google Scholar]
- Fleming, D. P., Barnes, R., Davenport, J. R. A., & Luger, R. 2019, ApJ, 881, 88 [Google Scholar]
- Gaia Collaboration (Brown, A. G. A., et al.) 2021, A&A, 649, A1 [NASA ADS] [CrossRef] [EDP Sciences] [Google Scholar]
- García Soto, A., Newton, E. R., Douglas, S. T., Burrows, A., & Kesseli, A. Y. 2023, AJ, 165, 192 [CrossRef] [Google Scholar]
- Gershberg, R. E. 1972, Ap&SS, 19, 75 [Google Scholar]
- Gutiérrez Albarrán, M. L., Montes, D., Tabernero, H. M., et al. 2024, A&A, 685, A83 [NASA ADS] [CrossRef] [EDP Sciences] [Google Scholar]
- Günther, M. N., Zhan, Z., Seager, S., et al. 2020, AJ, 159, 60 [Google Scholar]
- Hallinan, G., Bourke, S., Lane, C., et al. 2007, ApJ, 663, L25 [NASA ADS] [CrossRef] [Google Scholar]
- Hallinan, G., Antonova, A., Doyle, J. G., et al. 2008, ApJ, 684, 644 [Google Scholar]
- Hartmann, L. W., & Noyes, R. W. 1987, ARA&A, 25, 271 [Google Scholar]
- Hartman, J. D., Gaudi, B. S., Holman, M. J., et al. 2008, ApJ, 675, 1254 [Google Scholar]
- Holzwarth, V. 2007, Mem S. AIt, 78, 271 [Google Scholar]
- Houdebine, E. R., Mathioudakis, M., Doyle, J. G., & Foing, B. H. 1996, A&A, 305, 209 [NASA ADS] [Google Scholar]
- Howard, W. S., Corbett, H., Law, N. M., et al. 2019, ApJ, 881, 9 [NASA ADS] [CrossRef] [Google Scholar]
- Ilin, E., Schmidt, S. J., Poppenhäger, K., et al. 2021, A&A, 645, A42 [NASA ADS] [CrossRef] [EDP Sciences] [Google Scholar]
- Ilin, E., Poppenhäger, K., Stelzer, B., & Dsouzal, D. 2024, A&A 687, A138 [NASA ADS] [CrossRef] [EDP Sciences] [Google Scholar]
- Isik, E., Solanki, S. K., Cameron, R. H., & Shapiro, A. I. 2024, ApJ, 976, 215 [Google Scholar]
- Jackman, J. A. G. 2022, MNRAS, 517, 3832 [Google Scholar]
- Jeffries, R. D., Jackson, R. J., Briggs, K. R., Evans, P. A., & Pye, J. P. 2011, MNRAS, 411, 2099 [Google Scholar]
- Lu, Y., Angus, R., Foreman-Mackey, D., & Hattori, S. 2024, AJ, 167, 159 [Google Scholar]
- Lurie, J. C., Vyhmeister, K., Hawley, S. L., et al. 2017, AJ, 154, 250 [Google Scholar]
- Luyten, W. J. 1979, NLTT catalogue. Volume_I. +90__to_+30_. Volume._II. +30__to_0_. [Google Scholar]
- Newton, E. R., Irwin, J., Charbonneau, D., et al. 2016, ApJ, 821, 93 [Google Scholar]
- Paegert, M., Stassun, K. G., Collins, K. A., et al. 2021, arXiv e-prints [arXiv:2108.04778] [Google Scholar]
- Pass, E. K., Charbonneau, D., Irwin, J. M., & Winters, J. G. 2022, ApJ, 936, 109 [NASA ADS] [CrossRef] [Google Scholar]
- Pettersen, B. R. 1989, SoPh, 121, 299 [Google Scholar]
- Ramsay, G., Doyle, J. G., & Doyle, L. 2020, MNRAS, 497, 2320 [NASA ADS] [CrossRef] [Google Scholar]
- Ramsay, G., Kolotkov, D., Doyle, J. G., & Doyle, L. 2021, SoPh, 296, 162 [Google Scholar]
- Ramsay, G., Hakala, P., Doyle, J. G., Doyle, L., & Bagnulo, S. 2022, MNRAS, 511, 2755 [NASA ADS] [CrossRef] [Google Scholar]
- Ramsay, G., Hakala, P., & Doyle, J. G. 2024, A&A, 689, A288 [NASA ADS] [CrossRef] [EDP Sciences] [Google Scholar]
- Reiners, A., Shulyak, D., Käpylä, P. J., et al. 2022, A&A, 662, A41 [NASA ADS] [CrossRef] [EDP Sciences] [Google Scholar]
- Ricker, G., Winn, J., Vanderspek, R., et al. 2015, JATIS, 1, 14003 [Google Scholar]
- Schussler, M., & Solanki, S. K. 1992, A&A 264, L13 [Google Scholar]
- Seli, B., Vida, K., Moór, A., Pál, A., & Oláh, K. 2021, A&A, 650, A138 [NASA ADS] [CrossRef] [EDP Sciences] [Google Scholar]
- Skumanich, A. 1972, ApJ, 171, 565 [Google Scholar]
- Soderblom, D. R. 2010, ARA&A, 48, 581 [Google Scholar]
- Wang, Y.-F., Luo, A.-Li, Chen, W.-Ping, et al. 2022, A&A, 660, A38 [NASA ADS] [CrossRef] [EDP Sciences] [Google Scholar]
All Tables
All Figures
|
Fig. 1 Differential photometry of LP 89-187 obtained using HiPERCAM, with gs (colour-coded green), rs (yellow), is (orange), and zs (red) shown from the bottom to top. The differential flux for each 0.74 s exposure is normalised by dividing by the mean in each band, and each subsequent filter has been shifted vertically by 0.5. Time zero corresponds to MJD=60 350.902. The residual features, including the flare-like features in the gs band, are due to poorer conditions. The signature of the star’s rotation has largely been removed due to the large colour difference between the target and the two comparison stars. |
| In the text | |
|
Fig. 2 Three flares detected in TESS observations of LP 89-187 using 2 min cadence data. The start time of each flare is, from left to right, MJD=59 581.12, 59 592.19 (both Sector 47), and 59 942.01 (Sector 60). |
| In the text | |
|
Fig. 3 Bolometric flare frequency distribution of LP 89-187 as derived from three sectors of TESS data shown in blue. The blue arrow indicates the upper limit derived from the HiPERCAM observations. We show the bolometric flare frequency distribution of stars in the β Pic moving group in orange (spectral type ≲ M2) and in red (spectral type ≳ M3). We also show the flare frequency distribution of TRAPPIST-1 analogue stars (dashed black line) and TRAPPIST-1 using K2 data (dashed brown line) taken from Fig. 21 of Seli et al. (2021). |
| In the text | |
|
Fig. 4 Folded light curves of LP 89-187 across three TESS sectors. The phase has been shifted so that the flux maximum occurs at φ=0.0. |
| In the text | |
|
Fig. 5 Amplitude of the modulation versus period of stars taken from Ramsay et al. (2024) with a low spread in the period between TESS sectors (δLS < 0.05). LP 89-187 is shown as a blue cross; its slope has an index of −0.19 with a significance of p=0.0016. |
| In the text | |
Current usage metrics show cumulative count of Article Views (full-text article views including HTML views, PDF and ePub downloads, according to the available data) and Abstracts Views on Vision4Press platform.
Data correspond to usage on the plateform after 2015. The current usage metrics is available 48-96 hours after online publication and is updated daily on week days.
Initial download of the metrics may take a while.