Fig. 2
Download original image
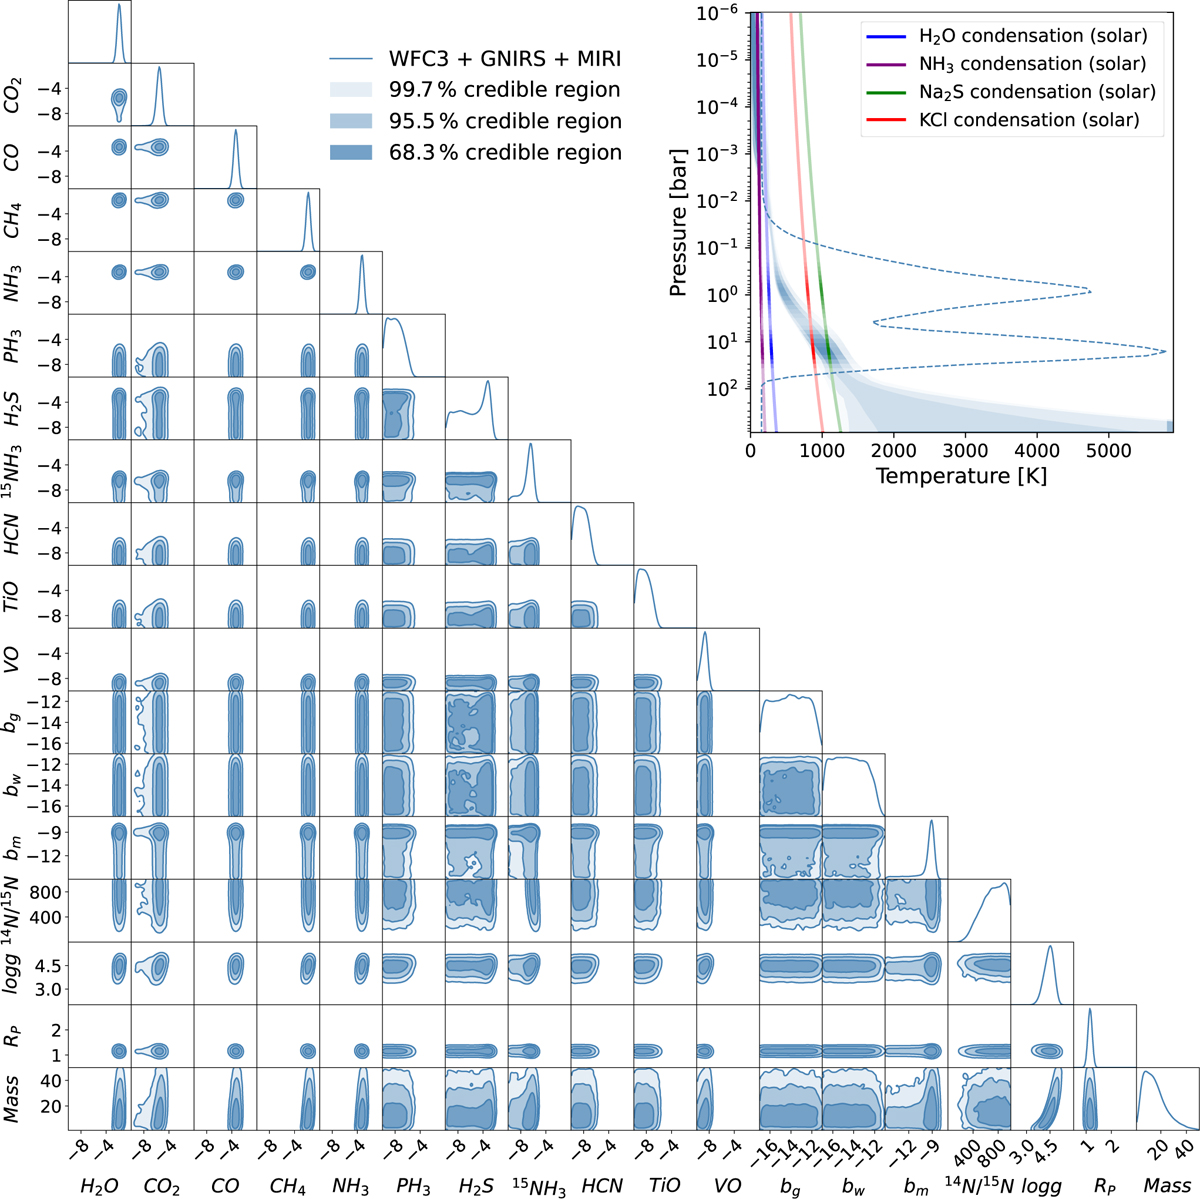
Cloud-free retrieval results using neural posterior estimation on the WISE 1738 spectra. The corner plot shows the full 1D and 2D marginal posterior distributions obtained for the WISE 1738 observations xobs, WFC3+GNIRS+MIRI spectra. The top right figure shows the posterior distribution of the P-T profile. The profile also has the emission contribution function overlaid on top, in shades of white highlighting visibility. The equilibrium state water ice, ammonia, metal chloride and sulfide condensation curves are plotted along the profile in blue, purple, red, and green, respectively for solar metallicity [M/H] and C/O ratio.
Current usage metrics show cumulative count of Article Views (full-text article views including HTML views, PDF and ePub downloads, according to the available data) and Abstracts Views on Vision4Press platform.
Data correspond to usage on the plateform after 2015. The current usage metrics is available 48-96 hours after online publication and is updated daily on week days.
Initial download of the metrics may take a while.