Fig. 3
Download original image
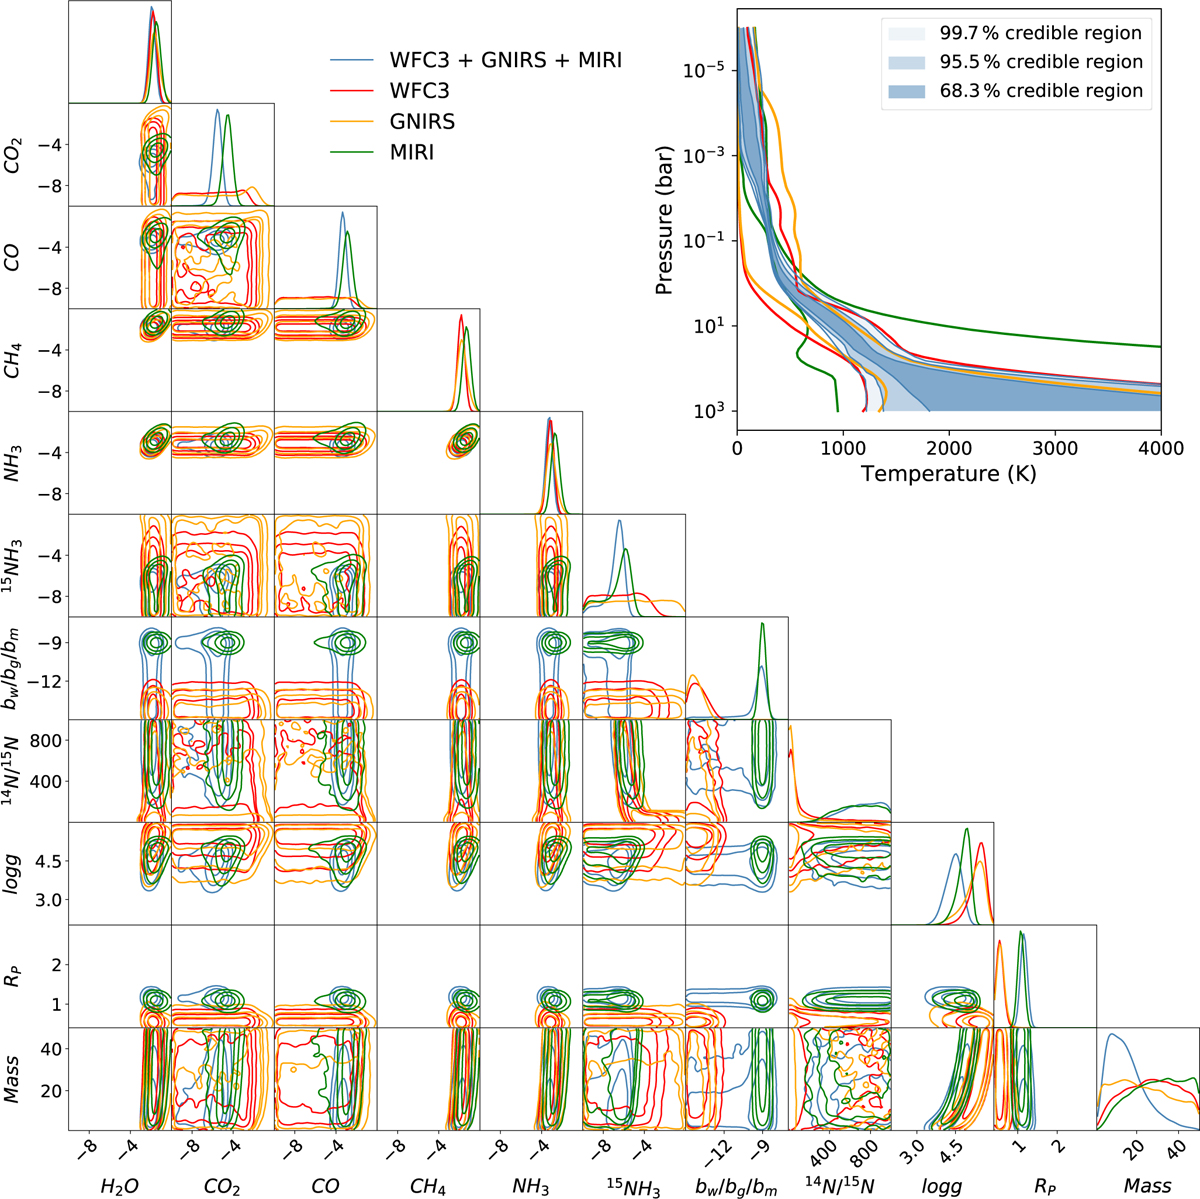
Comparing individual and combined spectral retrievals of WISE 1738 across different wavelength regions. The corner plot shows 1D and 2D marginal posterior distributions obtained for the WFC3, GNIRS, and MIRI spectrum along with the combined WFC3+GNIRS+MIRI spectra. The top right figure illustrates the posterior distribution of the P – T profile of the combined retrieval, while also highlighting the 99.7% credible intervals of the three independent retrievals.
Current usage metrics show cumulative count of Article Views (full-text article views including HTML views, PDF and ePub downloads, according to the available data) and Abstracts Views on Vision4Press platform.
Data correspond to usage on the plateform after 2015. The current usage metrics is available 48-96 hours after online publication and is updated daily on week days.
Initial download of the metrics may take a while.