Fig. 4
Download original image
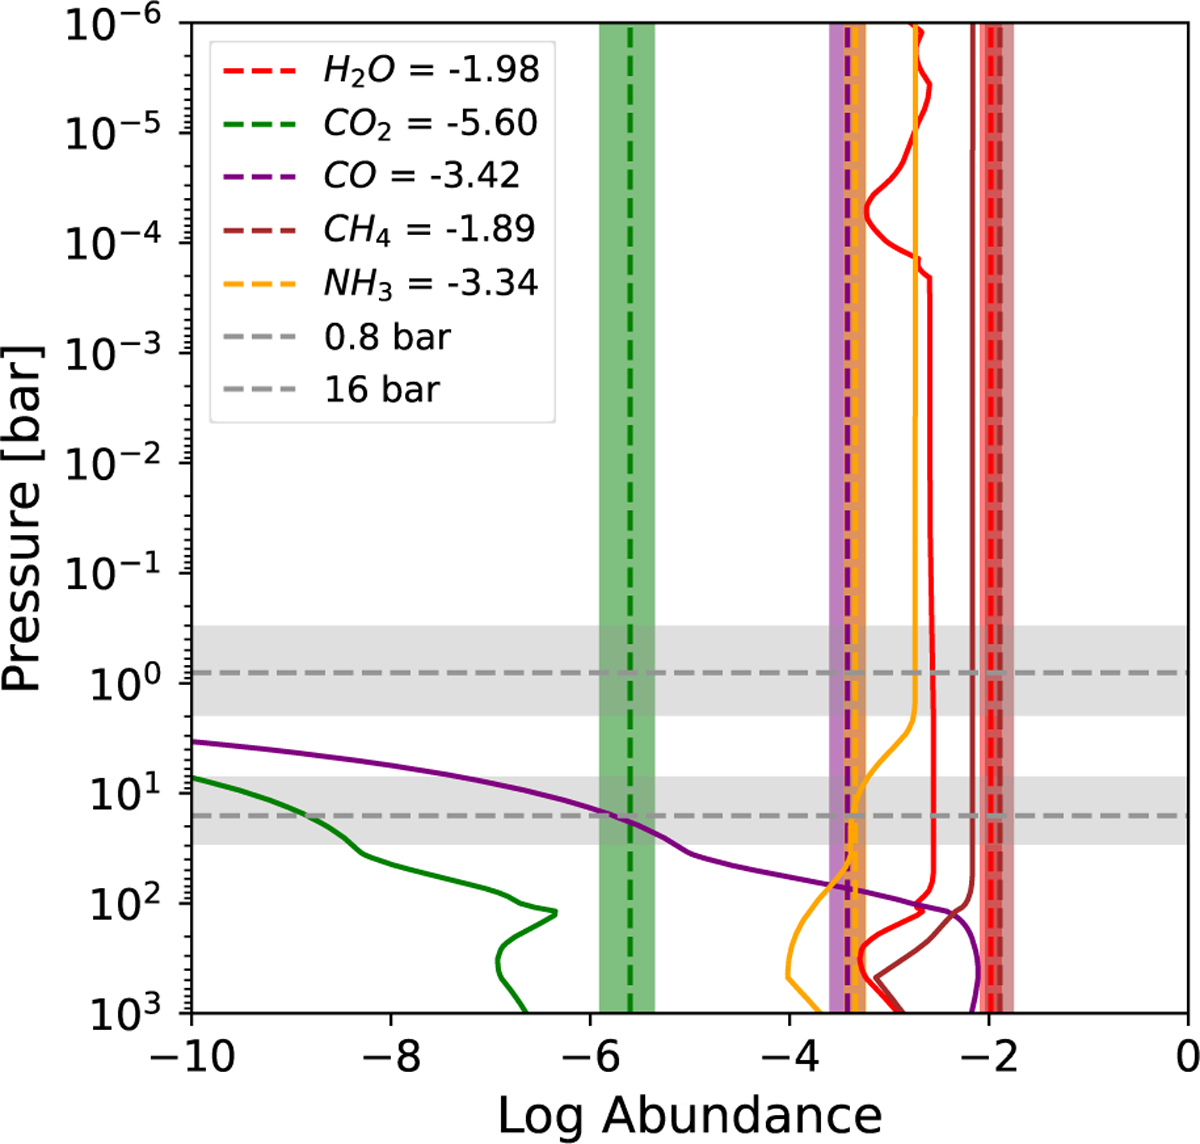
Comparing chemical equilibrium abundances with retrieved values. The plot compares equilibrium chemistry abundance for molecules used in the retrievals (shown in dashed lines, including 1σ uncertainties as colored bars), setup within an atmosphere with C/O = 1.35 and [M/H] = 0.34 (in solid lines), calculated using the retrieved most probable P-T profile. The molecular abundances are in units of mass fractions. The plot includes key opacity-contributing species: H2O (red), CO2 (green), CO (purple), CH4 (brown), and NH3 (orange). The gray regions are the estimated 1σ of the emission contribution functions for the MIRI probed photosphere (at the top) and the near-infrared probed photosphere (at the bottom).
Current usage metrics show cumulative count of Article Views (full-text article views including HTML views, PDF and ePub downloads, according to the available data) and Abstracts Views on Vision4Press platform.
Data correspond to usage on the plateform after 2015. The current usage metrics is available 48-96 hours after online publication and is updated daily on week days.
Initial download of the metrics may take a while.