Fig. 5
Download original image
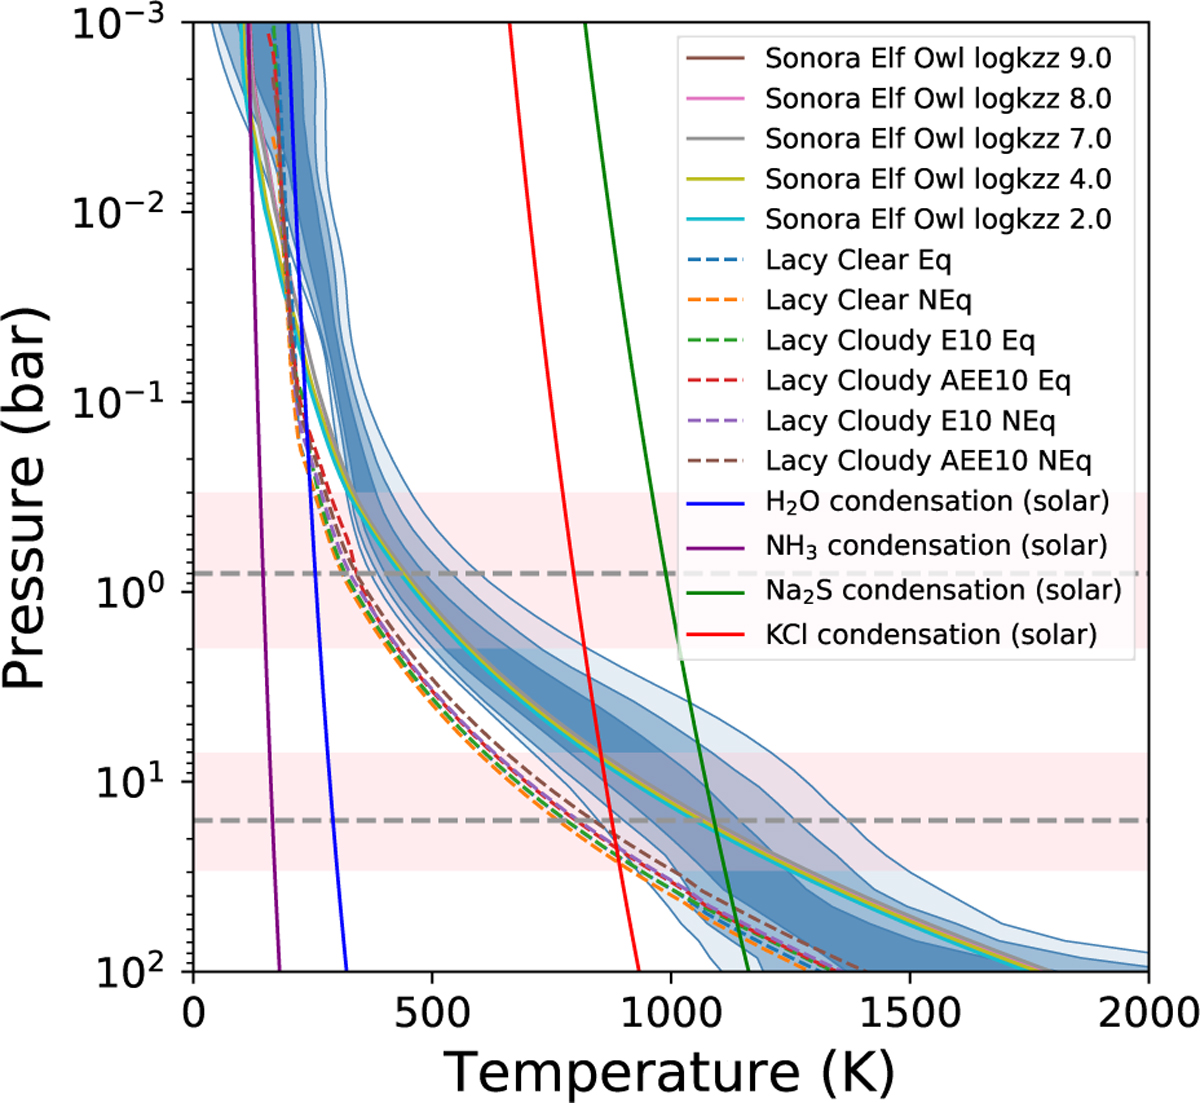
Comparison of the P-T posterior of WISE 1738 with the nearest possible grid model (in terms of Teff, log g, composition, etc) from Lacy & Burrows (2023) and Sonora Elf Owl (Mukherjee et al. 2024), for several clear and cloudy, and equilibrium and dis-equilibrium conditions. The pink regions are the estimated 1σ of the emission contribution functions for the MIRI probed photosphere (at the top) and the near-infrared probed photosphere (at the bottom). The equilibrium state water ice, ammonia, metal chloride and sulfide condensation curves are plotted along the profile in blue, purple, red, and green respectively for solar metallicity and C/O ratio.
Current usage metrics show cumulative count of Article Views (full-text article views including HTML views, PDF and ePub downloads, according to the available data) and Abstracts Views on Vision4Press platform.
Data correspond to usage on the plateform after 2015. The current usage metrics is available 48-96 hours after online publication and is updated daily on week days.
Initial download of the metrics may take a while.