Fig. B.1
Download original image
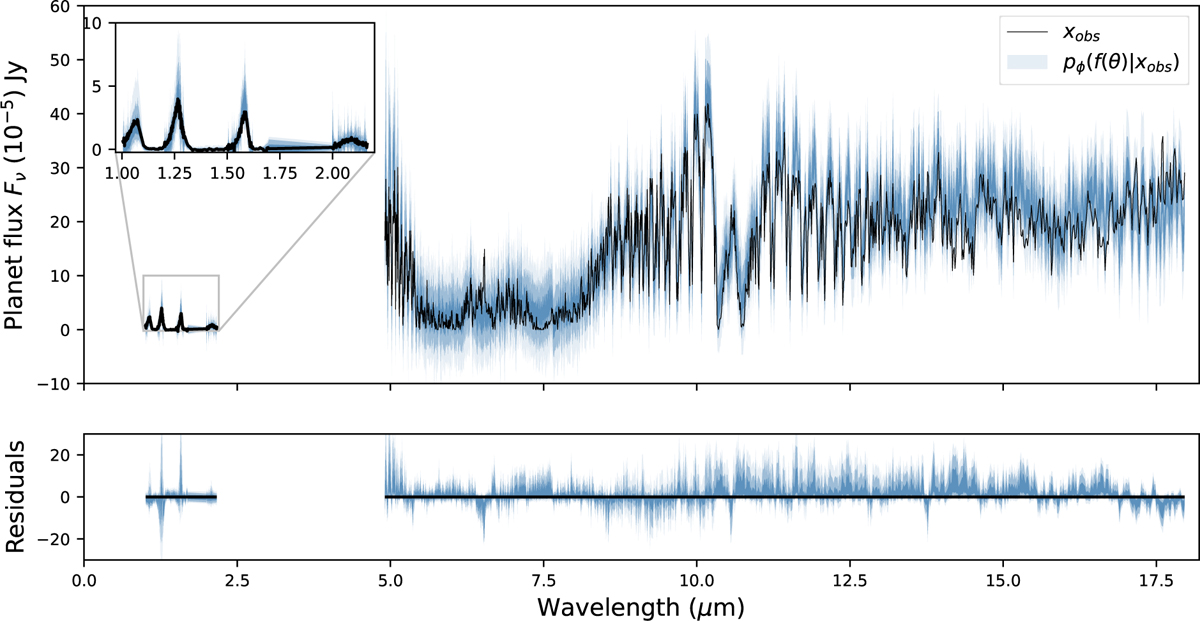
Top. WFC3+GNIRS+MIRI consistency plot. The posterior predictive distribution ![]() of noisy simulations spectra for the 99.7%, 95% and 68.7% quartiles (hues of blue), overlaid on top of the WFC3+GNIRS+MIRI observation xobs (black line). Bottom. Residuals of the posterior predictive samples, normalized by the inflated standard deviation of the noise distribution for each spectral channel and a horizontal line at 0 for reference (in black).
of noisy simulations spectra for the 99.7%, 95% and 68.7% quartiles (hues of blue), overlaid on top of the WFC3+GNIRS+MIRI observation xobs (black line). Bottom. Residuals of the posterior predictive samples, normalized by the inflated standard deviation of the noise distribution for each spectral channel and a horizontal line at 0 for reference (in black).
Current usage metrics show cumulative count of Article Views (full-text article views including HTML views, PDF and ePub downloads, according to the available data) and Abstracts Views on Vision4Press platform.
Data correspond to usage on the plateform after 2015. The current usage metrics is available 48-96 hours after online publication and is updated daily on week days.
Initial download of the metrics may take a while.