| Issue |
A&A
Volume 703, November 2025
|
|
|---|---|---|
| Article Number | A110 | |
| Number of page(s) | 8 | |
| Section | Extragalactic astronomy | |
| DOI | https://doi.org/10.1051/0004-6361/202554285 | |
| Published online | 13 November 2025 | |
ALMA discovery of Punctum, a highly polarized millimeter source in the nuclear starburst galaxy NGC 4945
1
Instituto de Estudios Astrofísicos, Facultad de Ingeniería y Ciencias, Universidad Diego Portales, Av. Ejército Libertador 441, Santiago, Chile
2
Kavli Institute for Astronomy and Astrophysics, Peking University, Beijing 100871, China
3
Joint ALMA Observatory, Avenida Alonso de Cordova 3107, Vitacura, Santiago 7630355, Chile
4
INAF, Istituto di Radioastronomia di Bologna, via Piero Gobetti 101, 40129 Bologna, Italy
5
Department of Space, Earth and Environment, Chalmers University of Technology, SE-412 96 Gothenburg, Sweden
6
Eureka Scientific, 2452 Delmer Street Suite 100, Oakland, CA 94602-3017, USA
7
Space Science Institute, 4750 Walnut Street, Suite 205, Boulder, CO 80301, USA
8
Department of Earth and Space Science, Osaka University, 1-1 Machikaneyama, Toyonaka, 560-0043 Osaka, Japan
9
Kavli Institute for Particle Astrophysics & Cosmology (KIPAC), Stanford University, Stanford, CA 94305, USA
10
Department of Astronomy, University of Maryland, College Park, MD 20742, USA
11
Joint Space-Science Institute, University of Maryland, College Park, MD 20742, USA
12
National Radio Astronomy Observatory, Charlottesville, VA 22903, USA
13
Department of Astronomy, University of Florida, Gainesville, FL 32611, USA
14
Department of Astronomy, University of Virginia, Charlottesville, VA 22904, USA
⋆ Corresponding author: This email address is being protected from spambots. You need JavaScript enabled to view it.
Received:
26
February
2025
Accepted:
12
July
2025
Abstract
We report the discovery of a highly polarized millimeter (mm) continuum source in the central region of NGC 4945 that was identified through ALMA Band 3 observations. This starburst Seyfert 2 galaxy contains numerous compact mm sources, but only one, located approximately 3.″4 (∼60 pc) from the galactic center and unresolved with ∼0.″1 resolution, exhibits an unusually high polarization degree of 50% ± 14% that likely originates from nonthermal synchrotron radiation. The source is faint, but clearly detected in two separate epochs of observation taken 14 days apart, with a flux of 0.104 ± 0.018 and 0.125 ± 0.016 mJy. It was also detected in earlier ALMA observations, where it showed no variability at any timescale. The spectral index remains stable within large uncertainties of −1.8 ± 2.5 and −1.3 ± 2.4. The source, which we further refer to as Punctum because it is so compact, revealed no clear counterparts in existing X-ray or radio observations. Assuming an association with the central region of NGC 4945, we estimated upper limits for its luminosity of ∼1 × 1037 erg s−1 in the 3–6 keV X-ray band (from archival Chandra data) and ∼5 × 1035 erg s−1 at 23 GHz (from archival ATCA data). A comparison of the radio, mm (including polarization), and X-ray properties with known astrophysical sources emitting synchrotron radiation, such as accreting neutron stars, supernova remnants, and nonthermal galactic filaments, revealed no clear match in any of these scenarios. The exact nature of this highly polarized source remains undetermined.
Key words: radiation mechanisms: non-thermal / techniques: polarimetric / galaxies: active / galaxies: individual: NGC 4945 / submillimeter: galaxies
© The Authors 2025
 Open Access article, published by EDP Sciences, under the terms of the Creative Commons Attribution License (https://creativecommons.org/licenses/by/4.0), which permits unrestricted use, distribution, and reproduction in any medium, provided the original work is properly cited.
This article is published in open access under the Subscribe to Open model. This email address is being protected from spambots. You need JavaScript enabled to view it. to support open access publication.
1. Introduction
Millimeter-wave (mm) observations in the ∼30–300 GHz range have become an important tool in extragalactic astronomy that offers unique access for probing cold gas, dust, and magnetic fields of galaxies. These observations enable us to trace the star formation across cosmic time (e.g. Decarli et al. 2019; Hodge & da Cunha 2020), to map the dust and gas dynamics in both local (e.g. Leroy et al. 2021) and high-redshift galaxies (e.g. Smit et al. 2018; Parlanti et al. 2023), and to reveal the large-scale structure of the magnetic field in galaxies even well beyond cosmic noon (Geach et al. 2023; Chen et al. 2024). This progress has been made possible largely through the Atacama Large Millimeter/submillimeter Array (ALMA), whose unprecedented combination of sensitivity and angular resolution has transformed our ability to resolve compact and extended emission on subarcsecond scales.
Observations in the mm band have also opened a window into the nonthermal emission produced by plasma in the immediate vicinity of accreting supermassive black holes (SMBHs) in active galactic nuclei (AGNs). The most striking demonstration of this capability is the imaging of the SMBH shadow and the toroidal magnetic field structure in the jetted AGN M87* by the Event Horizon Telescope Collaboration (2019, 2021). While this is the most prominent example, it is not unique: even in nonjetted so-called radio-quiet (RQ) AGNs, high-resolution mm observations have revealed compact cores whose fluxes are tightly correlated with X-ray emission (Laor & Behar 2008; Behar et al. 2018; Kawamuro et al. 2022; Ricci et al. 2023) and are consistent with synchrotron radiation from regions with sizes of only a few tens of gravitational radii (Shablovinskaya et al. 2024; del Palacio et al. 2025; Rybak et al. 2025). The physical origin of this emission, which might be linked to the X-ray corona, compact jets, or shock-related processes, remains under active investigation.
To investigate the properties of synchrotron mm emission from compact cores in RQ AGNs, we initiated the first dedicated ALMA polarimetric campaign. The results were detailed in Shablovinskaia et al. (2025). Our sample was drawn from the list of compact mm bright RQ AGNs compiled by Ricci et al. (2023) and included NGC 4945, which is a well-known nearby galaxy at a redshift of z = 0.0023 and a distance of D = 3.72 Mpc1. Viewed nearly edge-on, NGC 4945 hosts a heavily obscured, Compton-thick AGN with a column density of  (Ricci et al. 2015, 2017), and is optically classified as a type 2 AGN (Lipovetsky et al. 1988). Alongside its active nucleus detected at 100–220 GHz (Kawamuro et al. 2023; Ricci et al. 2023), the galaxy exhibits intense nuclear star formation, as revealed by free–free continuum and hydrogen recombination line emission (Emig et al. 2020). This makes NGC 4945 a particularly attractive target not only for probing the polarized mm emission from its AGN core (which was found to be undetected at the 0.5% level; Shablovinskaia et al. 2025), but also for investigating the polarization properties of other mm sources throughout the galaxy.
In this paper, we present ALMA Band 3 polarization observations of the ∼200 pc inner region of the active starburst galaxy NGC 4945. Our findings indicate that nearly all mm emitting sources in the galaxy show no detectable polarization (much lower than 1.5%), with the exception of a peculiar unidentified source located above the galactic plane, which exhibits extremely high polarization. In the following sections, we summarize the properties of this source and compare them with the potential origins of polarized mm emission. Throughout the paper, we used the standard cosmological parameters (H0 = 70 km s−1 Mpc−1, Ωm = 0.3, and ΩΛ = 0.7).
2. Observations and data reduction
The ALMA Band 3 observations of NGC 4945 were conducted in two sessions: The first session was on 11 October 2023, and the second on 25 October 2023 (project code 2023.1.01517.S; PI C. Ricci). The spectral setup was in time-division mode (TDM) centered around 100 GHz, targeting the continuum emission of the galaxy. The observations were performed across four spectral windows with a 1.985 GHz bandwidth and central frequencies of 90.52, 92.48, 102.52, and 104.48 GHz. During the first session (hereafter referred to as S1), an insufficient parallactic angle coverage (51.12° instead of the desired 60.00°) for the polarization calibrator J1256–0547 prompted the need for a second session (hereafter S2).
Observations were scheduled during the ALMA long-baseline configuration (C-8), with the longest baseline extending to 8.5 km. The restored beam size for S1 was 0 123 × 0
 105 (2.2 × 1.9 pc), and for S2, it was 0
 140 × 0
 102 (2.5 × 1.8 pc). The on-source integration times were 38 minutes for S1 and 75 minutes for S2. The rms background in the restored ALMA image in total intensity is σ = 0.017 mJy/beam for S1 and 0.014 mJy/beam for S2. The data were processed using CASA version 6.5.4.9 and the ALMA pipeline version 2023.1.0.124 (Hunter et al. 2023). The clean images were generated using CASA task tclean with weighting = briggs (robust = 0.5).
According to the ALMA Proposer’s Guide, the systematic flux error for Band 3 observations is 5%. Flux measurements from the polarization calibrators J1256−0547 (in S1) and J1427−4206 (in S2), and for the check source J1254−4743, yielded consistent results, which justifies the 5% error margin we applied in our analysis. Furthermore, the estimated degree and angle of polarization for the calibrators were consistent with the measurements from the AMAPOLA calibrator monitoring2 in the S1 and S2 epochs, which indicates that the polarization measurements at S1 also remained reliable.
For each epoch, we created maps of the total and polarized intensity. The circular polarization component was assumed to be zero, as it is typically weak in the mm regime, and the polarized intensity was therefore calculated as  , where Q and U are the Stokes parameters in units of flux. The polarization degree was then calculated as PD = P/I, where I is the total intensity, and debiased following the method outlined by Montier et al. (2015a,b). The total and polarized intensity maps and the PD maps for the selected sources are shown in Figs. 1 and A.1.
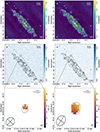 |
Fig. 1. ALMA observations of NGC 4945 on 11 October 2023 (S1, left column) and on 25 October 2023 (S2, right column). Upper panel: Total intensity with the contours corresponding to the 0.07, 0.19, 0.31, and 0.54 mJy/beam levels in the box ∼10 × 10″. The location of the AGN is marked with a red cross. Middle panel: Polarized intensity. The total intensity contours are overplotted. Bottom panel: Polarization degree in percent in the box of ∼0.5 × 0.5″. The orientation of the polarization vector is given with black ticks. |
3. Results
Despite the abundance of bright mm sources in the central part of NGC 4945, as shown in the total intensity maps in Figs.1a,d, nearly all sources disappear in polarized light. The polarized intensity maps (Figs. 1b,e) reveal only a few regions with significant polarized mm emission. The central mm emission in NGC 4945 spans about 14″ and covers less than one-third of the ∼60″ field of view, which ensures an accurate polarization calibration (Cortes et al. 2023). To accurately estimate the polarization degree, we created the PD maps by masking areas with a signal-to-noise ratio (S/N) < 5 to avoid bias and unreliable polarization measurements in low-S/N regions. Initially, for the two observation epochs S1 and S2, we identified several compact regions with a polarization exceeding ∼1.5%. Upon comparing these maps, however, we found that most of these initially detected polarized regions did not appear in both epochs, which prevented us from confirming them as real sources. Ultimately, we confirmed only two polarized regions that were consistently observed during both S1 and S2.
The first polarized region is an extended structure with a flux of ∼0.5 mJy, located 0 5 (i.e., ∼9 pc) from the central AGN (RA 13:05:27.440, Dec −49:28:05.670). Maps of the polarized intensity and PD are shown in Fig. A.1. This source resides at the edge of the bright molecular disk, which, based on our ALMA Band 3 observations, reprocessed into spectral cubes with a channel width of 31.2 MHz, emits in the continuum and in several emission lines, including HCN(1–0), HC3N(10–9), and N2H+(1–0). Because it lies close to a much brighter unpolarized mm emitting extended region, it is difficult to isolate the source of polarized emission. Contamination from the unpolarized component might significantly reduce the measured polarization. The estimated polarization degrees are 14% ± 4% and 8% ± 2% for S1 and S2, respectively, with errors given at the 3σ level. Because it is difficult to isolate this region from brighter sources, we did not focus on it further; its PD map is included in Appendix A.
The most intriguing structure was found ∼3 4 (i.e., ∼61 pc) away from the galactic center (RA 13:05:27.600, Dec −49:28:02.242). This compact source is well isolated from other mm continuum sources in the galactic disk, although it is faint. We measured its flux in each epoch and found values of 0.104 ± 0.018 mJy for S1 and 0.125 ± 0.016 mJy for S2 averaged over all spectral windows with S/N ∼ 6.1 and 8.9, respectively. Over the 14-day interval between the two epochs, the flux of this polarized structure varied by ∼18%, corresponding to a difference of only ∼1.2σ. This is not statistically significant, but might suggest variability. Additionally, we measured the flux in each of the four spectral windows (see Table 1), but found no statistically significant variations between the epochs. The spectral indices α, obtained by fitting the spectra with a power law (∝να) and accounting for flux uncertainties, were α = −1.8 ± 2.5 for S1 and α = −1.3 ± 2.4 for S2, showing no statistically significant difference between the two epochs. All values are summarized in Table 1; we note that the flux uncertainties were computed as the quadrature sum of the 5% Band 3 calibration uncertainty and the background rms measured in each corresponding image.
ALMA Band 3 fluxes and the spectral index of the highly polarized mm source in NGC 4945 for epochs S1 (2023–10–11) and S2 (2023–10–25).
Furthermore, we analyzed the source flux in each spectral window by dividing it into frequency bins with a step of 31.2 MHz. Because the source is faint, this spectral analysis mostly revealed noise, with no evidence of the emission lines that are typically found in the molecular gas of NGC 4945, not even at the 1σ level.
Although faint in total flux, the source became brightest in polarized intensity throughout NGC 4945. In the PD map, the source exhibits an exceptionally high level of polarization that is consistent in both epochs: 51% ± 14% for S1 and 50% ± 14% for S2, with a polarization angle of 133.2° ± 7.9° for S1 and 130.6° ± 7.8° for S2. Unfortunately, the source is too faint for us to reliably estimate the PD per frequency or per spectral window because of the high noise, which prevents us from tracing polarization changes across the spectral windows.
4. Search for the counterparts
It is quite rare to observe such a large PD (about 50%) in astrophysical sources. This significant PD, combined with the steep spectral index, strongly suggests that the emission can only be explained by an optically thin synchrotron source with a highly uniform magnetic field structure. To better understand the nature of this source, which we refer to as Punctum3 because it is compact and its origin is unknown, observations at other wavelengths should be explored.
Radio. According to Australia Telescope Compact Array (ATCA) data from Lenc & Tingay (2009), no specific or isolated source corresponding to Punctum was detected at frequencies of 17, 19, 21, and 23 GHz, with 1σ detection limits of 0.25–0.34 mJy/beam at a resolution of ∼0 5. In the same study, high-resolution (∼tens of milliarcseconds) Long Baseline Array (LBA) data at 2.3 GHz also show no detection of the source with a detection limit of ∼0.1 mJy/beam. Based on the 23 GHz nondetection, we can place a rough upper limit of ∼5 × 1035 erg s−1 on the radio luminosity of Punctum at this frequency. No specific detections were made with Very Long Baseline Array (VLBA) in the water maser lines either (Greenhill et al. 1997). In our ALMA Band 3 dataset, the flux density and spectral index uncertainties are so high that a reliable radio flux extrapolation is impossible. As a result, it remains unclear whether the radio upper limits are consistent with the mm data or if the mm emission is instead affected by absorption effects or source variability.
Other mm bands. When the resolution is lower than 0 3, Punctum cannot be separated from the mm emission of other nearby structures. According to the ALMA archive, observations with a resolution better than 0
 3 were conducted in Bands 3, 7, and 8. In Band 7 (∼350 GHz), no detection was made above the 3σ = 0.3 mJy/beam level. In Band 8, there is a faint detection of a structure with a flux of approximately 4.5 mJy, but it is comparable to the noise level, with 1σ = 3.5 mJy. No molecular emission was detected in this region (Henkel et al. 2018), nor any water megamasers at 183 GHz (Humphreys et al. 2016).
While NGC 4945 has been observed multiple times in Band 3 with a high resolution, only two additional epochs, apart from our observations, had sufficient on-source time to detect the source at least at the 3σ level. The archival Band 3 data, together with our new observations, are presented in Fig. 2. For the epoch of 11 July 2021 (2019.1.00416.S, PI: He), the relatively low resolution (∼0 3) allowed only upper limits to be derived for the flux. For the epoch of 14 July 2019 (2018.1.01236.S, PI: Leroy), however, the resolution (∼0
 1) matched that of S1 and S2. In this case, the flux averaged over the spectral windows was measured to be 0.150 ± 0.015 mJy, assuming a 5% error and background rms σ = 0.014 mJy/beam, with S/N ∼ 11. This indicates that the observed flux variations of Punctum over the four-year period remain within 3σ uncertainties and are therefore not statistically significant. It is also noteworthy that, for this epoch, the spectral slope is flatter, 0.02 ± 1.51, but comparable to that observed during polarimetric observations within the uncertainties.
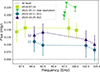 |
Fig. 2. ALMA observations of the Punctum in different epochs. Due to the low resolution on 11 July 2021, only upper limits are given. The 3σ ∼ 0.05 mJy level for S1 and S2 epochs is given as the dotted black line. |
IR and optical. For NGC 4945, data from the James Webb Space Telescope are available for other regions of the galaxy, but not for the zone of interest. Spitzer observations of the central region of NGC 4945 have a saturated flux, which makes them unsuitable for further analysis. In the optical observations, NGC 4945 is oriented almost edge-on and is a type 2 AGN, in which the central parts are covered with dust. Therefore, no specific features can be found in archival HST data from 1999–2000 or in more recent MUSE observations from 2015 (094.B-0321, PI: Marconi), which show no specific features in this area in the ∼4760–9340 Å range.
X-ray. For NGC 4945, several epochs of Chandra observations are available. Given the faintness of the object, we selected the epoch of 25 April 2013 with the longest exposure of 130.5 ksec (ObsID 14984). The central region of NGC 4945 exhibits extended emission (∼10″), which is associated with the central AGN and the surrounding star-forming region. We did not identify any specific counterpart to Punctum, however.
To estimate the upper limit of the X-ray luminosity of this source, we extracted the X-ray spectra and applied a phabs*powerlaw model, where phabs represents the Galactic absorption predicted using the NH tool within FTOOLS (Dickey & Lockman 1990; Kalberla et al. 2005). We then used the cflux model of XSPEC to calculate the flux in the 3.0–6.0 keV band, resulting in an upper limit of 7.1 × 10⁻¹⁵ erg s−1 cm−2 with a photon index of −0.60 , corresponding to a luminosity of 1.2 × 1037 erg s−1. It is important to note that this represents an upper limit because contributions from surrounding star-forming material were not accounted for. No distinct X-ray source was identified as a counterpart to the polarized mm emission.
5. Discussion
In summary, we observed an unresolved source with a mm flux of ∼0.1 mJy at 100 GHz and an exceptionally high polarization of ∼50%. The absence of an optical counterpart suggests that the source is not Galactic and is most likely embedded within the central region of the galaxy NGC 4945, obscured by dust. Furthermore, the source is unlikely to be a background object, such as a blazar, which are known to exhibit much lower degrees of polarization in the mm band, typically ∼15% at maximum, according to the AMAPOLA database4. Moreover, while the number density of blazars at these low flux levels is not commonly reported, we extrapolated the number counts from Tucci et al. (2011) and estimated that the probability of finding a blazar with a flux of ∼0.1 mJy within 3 4 of the nucleus of NGC 4945 is lower than 0.4%. Based on this, we assume in the following discussion that the source is located in NGC 4945.
Punctum was detected in multiple epochs of high-resolution ALMA observations (see Fig. 2) and showed no significant flux variations beyond the 3σ level between 2019 and 2023. This effectively rules out a transient event such as a gamma-ray burst because the mm flux from them typically diminishes rapidly within the first 200 days (Laskar et al. 2018), and their mm polarization is expected to be very low (< 1%, Laskar et al. 2019). The observed mm polarization is also significantly higher than that typically associated with sources in which polarization arises from scattering on dust, as seen in protoplanetary disks, which exhibit a polarization of only a few percent (Stephens et al. 2023). Similarly, polarization from magnetized thermal dust is much lower, ranging from ≲1% (e.g. Geach et al. 2023) to ∼3–4% (e.g. Bonavera et al. 2017; Clements et al. 2025). Moreover, the expected spectral index of dust emission in the mm regime is ∼3.5 (Mullaney et al. 2011), which definitively rules out a dust-related origin.
The polarization of ∼50% suggests the presence of an ordered magnetic field. As only continuum emission has been detected from this source, with no emission lines present, a maser origin is ruled out. The most plausible scenario is the synchrotron emission of a source with an ordered magnetic field. The source has significant luminosity in the mm band, Lmm ∼ 2 × 1035 erg s−15. Moreover, the source is expected to be compact. As in ALMA observations, its structure was unresolved, and the size should be ≲2 pc. Because no significant variability was detected between the epochs, however, we cannot place any upper limit on the source size based on variability timescales. Additionally, the large uncertainties in the spectral index in all epochs in 2019 and 2023 prevent us from reliably identifying a spectral turnover, which makes it difficult to constrain the source size via synchrotron self-absorption modeling. Assuming that the spectrum observed on 14 July 2019 is indeed flat due to synchrotron self-absorption, we can estimate the source size using Eq. (19) from Laor & Behar (2008). This yields 2 × 10⁻⁶ pc (∼1013 cm) for a magnetic field of 1 Gauss and 4 × 10⁻⁷ pc (∼1012 cm) for 1 mGauss. These estimates, however, remain highly uncertain, and in reality, the size of the emitting region is still largely unconstrained.
Among the known types of sources that can produce high-polarization degrees like these, accreting neutron stars are suitable candidates. The Punctum spectral index of −1.5 ± 1.7, calculated as the weighted mean from two epochs, agrees with typical pulsar spectral indices, with a mean value of α = −1.8 (Maron et al. 2000). As noted by Torne et al. (2017), however, pulsars are challenging to detect at radio frequencies above a few gigahertz, with only a handful of detections above 30 GHz (see Torne et al. 2017, for review). The pulsar with the highest flux density detected so far by ALMA, the Vela pulsar, was observed at 97.5 to 343.5 GHz and exhibited a flux of just ∼0.252 mJy at 97.5 GHz (Mignani et al. 2017). Based on a distance of ∼300 pc (Caraveo et al. 2001), the luminosity of the Vela pulsar is ∼3 × 1027 erg s−1, which is 108 times fainter than our source. The other mm emitting pulsar, PSR J1023+0038, was found to be 10 times brighter, that is, with a luminosity of ∼3 × 1028 erg s−1 (Baglio et al. 2023), which is still too faint to explain the emission observed in our case.
Magnetars are a subclass of neutron stars. They are comparatively bright in the mm band and belong to the top 3% of the most luminous pulsars that are characterized by stronger magnetic fields (Torne 2018). Notably, high polarization degrees have been observed in magnetars. For example, Liu et al. (2021) reported a linear polarization of nearly 100% at 86 GHz in SGR J1745–2900, albeit just during the pulse phases. Additionally, Kravchenko et al. (2016) observed 65% of the averaged polarization of the same source at 40–48 GHz with the Very Large Array (VLA), but no similar measurements were made at higher frequencies.
The high polarization supports a magnetar interpretation, but the mm luminosities of known magnetars are too faint to match that of the observed source. Several magnetars were observed at high frequencies: XTE J1810–197 (D = 3.5 kpc; Minter et al. 2008) showed 1.2 mJy at 88 GHz (Camilo et al. 2007), corresponding to ∼2 × 1030 erg s−1, while SGR J1745–2900, orbiting Sgr A* (D = 8 kpc; GRAVITY Collaboration 2019), exhibited fluxes between 0.6 and 6.4 mJy at 101 GHz (Torne et al. 2015, 2017), which is equivalent to ∼5 × 1031 erg s−1. This results in a substantial luminosity gap of a factor of 10 000 to 100 000 between these known sources and Punctum.
The only sources associated with a neutron star with comparable mm luminosities are supernova remnants (SNRs). Given the calculated star-formation rate of ∼2–8 M⊙ yr−1 for NGC 4945 (Roy et al. 2010), we can estimate the supernova rate using the relation from Cappellaro et al. (1999), which yields ∼2–8 SN per 100 years. This suggests that young SNRs are highly probable in this galaxy. Two supernovae have been detected in NGC 4945 in recent years, SN 2005af (Filippenko & Foley 2005) and 2011ja (Monard et al. 2011). They are both are located far from the central region, however, at ∼5 and 10 kpc, respectively, and no recent SN has been detected in the vicinity of Punctum. This absence might be attributed to significant dust obscuration, however, which may prevent the optical identification of a young supernova in the central regions of the galaxy.
An SNR can provide a high mm luminosity. For example, SN 1987A (D = 51.2 kpc; Panagia et al. 1991) shows flux in the range of ∼10–20 mJy at 94 GHz (Lakićević et al. 2012), corresponding to ∼6 × 1033 erg s−1. The brightest SNR, the Crab nebula (M1), exhibits a flux of ∼300 Jy at ∼100 GHz at a distance of 2 kpc (Macías-Pérez et al. 2010), which is equivalent to ∼2 × 1035 erg s−1. Moreover, the typical X-ray luminosities of SNRs are consistent with the upper limit of the X-ray luminosity observed for Punctum. X-ray observations of SNRs in the LMC (Ou et al. 2018) reveal luminosities ranging from 1034 to 1037 erg s−1. The radio-to-mm spectral index of M1 is nearly flat (around −0.3), which, within the uncertainties, might be consistent with that of Punctum. The mm polarization of M1 is significantly lower (∼7–8%; Ritacco et al. 2018), however, and therefore does not fully agree with the high polarization observed in Punctum.
Microquasars are stellar mass black holes or neutron stars. They might be candidates because their jets can produce bright mm emission with luminosities comparable to those of SNRs that reach ∼1033 erg s−1 (e.g., Martí et al. 2018). In certain states, their radio spectra become self-absorbed at low frequencies, with luminosities of 1029–1032 erg s−1 at frequencies of a few dozen gigahertz (e.g., Fender 2001), which is broadly consistent with the upper limit derived for Punctum. Martí et al. (2018) reported very low mm polarization (< 1%) in the brightest microquasar SS 433, however, which contradicts our observations.
Synchrotron emission can also arise from nonthermal filamentary structures located a few tens to hundreds of parsecs away from the galactic center. In the Milky Way galaxy, nonthermal filaments and radio loops were first discovered in the radio band (1.5 GHz, Yusef-Zadeh et al. 1984) as long, narrow, and highly collimated structures. Subsequent observations at various radio frequencies (e.g., Heywood et al. 2022; Vidal et al. 2015) revealed steep radio spectra with spectral indices around −1, which is consistent with the synchrotron origin of the filament radiation. Vidal et al. (2015) demonstrated that while the median radio polarization of the filaments is ∼10%, certain regions exhibit linear polarization as high as ∼40%. This agrees with earlier findings by Gray et al. (1995), who reported polarization of up to 50% in a segment of one filament. Although the observed polarization is consistent with the mm polarization of our polarized source, however, the brightest filaments have a maximum luminosity of about 1033 erg s−1 at 5 GHz (Gray et al. 1995). Given their steep spectra, the luminosity at 100 GHz would decrease to only a few times 1032 erg s−1, which remains insufficient to account for our mm source.
To summarize, none of the currently known sources exhibit the combination of properties – most notably the mm luminosity and polarization – seen in Punctum. This highlights its distinct nature.
6. Summary
The unprecedented sensitivity and angular resolution of ALMA, including its polarimetric capabilities, enabled deep polarimetric observations of the central starburst region in the type 2 active galaxy NGC 4945. In these observations, we discovered a faint (∼0.1 mJy), compact millimeter source located 3.4 pc from the AGN. In total intensity, the object, which we called Punctum, resembles other compact mm sources in NGC 4945, associated with embedded star clusters. Unlike the others, however, it exhibits significant linear polarization at a level of 50% ± 14%. Assuming it resides within the central region of NGC 4945, we estimated its mm luminosity to be ∼2 × 1035 erg s−1. Based on archival Chandra and ATCA data, we placed upper limits on its X-ray and radio luminosities of 1 × 1037 and 5 × 1035 erg s−1. Unfortunately, Punctum is too faint for us to reliably measure a spectral index or assess variability. As it remains unresolved, we placed an upper limit of ∼2 pc on its size.
The most plausible mechanism for producing such a high degree of linear polarization is synchrotron emission. We compared the properties of Punctum with known classes of synchrotron-emitting sources. Among these, magnetars are the most likely candidates because of their high polarization, although their mm luminosities are generally lower. SNRs, which have comparable mm and X-ray luminosities, typically exhibit low polarization. Galactic nonthermal filaments can produce high polarization, but are usually faint in the mm regime. Thus, Punctum cannot currently be associated with any known class of astrophysical source.
To determine its nature, deeper polarimetric observations in the mm and radio bands are required to constrain the spectral index and investigate a potential frequency dependence of the polarization. High-resolution multiwavelength follow-up observations would also be invaluable for a further characterization.
The redshift-independent distance was measured using the tip of the red giant branch (see Koss et al. 2022) and is consistent with the measurements from Karachentsev et al. (2007).
From Latin “pūnctum”, meaning “point” or “dot”.
This estimate assumes isotropic mm emission. While the nature of the source remains uncertain, relativistic beaming cannot be excluded and may imply a lower intrinsic luminosity.
Acknowledgments
This paper makes use of the following ALMA data: ADS/JAO.ALMA#2023.1.01517.S. ALMA is a partnership of ESO (representing its member states), NSF (USA) and NINS (Japan), together with NRC (Canada), NSTC and ASIAA (Taiwan), and KASI (Republic of Korea), in cooperation with the Republic of Chile. The Joint ALMA Observatory is operated by ESO, AUI/NRAO and NAOJ. We sincerely thank Ari Laor for the valuable comments and feedback. ES acknowledges ANID BASAL project FB210003 and Gemini ANID ASTRO21-0003. CR acknowledges support from Fondecyt Regular grant 1230345, ANID BASAL project FB210003 and the China-Chile joint research fund. YD acknowledges the financial support from a Fondecyt postdoctoral fellowship (3230310). TK is supported by JSPS KAKENHI grant numbers 23K13153/24K00673.
References
- Baglio, M. C., Coti Zelati, F., Campana, S., et al. 2023, A&A, 677, A30 [NASA ADS] [CrossRef] [EDP Sciences] [Google Scholar]
- Behar, E., Vogel, S., Baldi, R. D., Smith, K. L., & Mushotzky, R. F. 2018, MNRAS, 478, 399 [CrossRef] [Google Scholar]
- Bonavera, L., González-Nuevo, J., De Marco, B., Argüeso, F., & Toffolatti, L. 2017, MNRAS, 472, 628 [Google Scholar]
- Camilo, F., Ransom, S. M., Peñalver, J., et al. 2007, ApJ, 669, 561 [Google Scholar]
- Cappellaro, E., Evans, R., & Turatto, M. 1999, A&A, 351, 459 [NASA ADS] [Google Scholar]
- Caraveo, P. A., De Luca, A., Mignani, R. P., & Bignami, G. F. 2001, ApJ, 561, 930 [Google Scholar]
- Chen, J., Lopez-Rodriguez, E., Ivison, R. J., et al. 2024, A&A, 692, A34 [NASA ADS] [CrossRef] [EDP Sciences] [Google Scholar]
- Clements, D. L., Zhang, Q., Pattle, K., et al. 2025, MNRAS, 537, L67 [Google Scholar]
- Cortes, P., Vlahakis, C., Hales, A., et al. 2023, https://doi.org/10.5281/zenodo.7822943 [Google Scholar]
- Decarli, R., Walter, F., Gónzalez-López, J., et al. 2019, ApJ, 882, 138 [Google Scholar]
- del Palacio, S., Yang, C., Aalto, S., et al. 2025, A&A, 701, A41 [NASA ADS] [CrossRef] [EDP Sciences] [Google Scholar]
- Dickey, J. M., & Lockman, F. J. 1990, ARA&A, 28, 215 [Google Scholar]
- Emig, K. L., Bolatto, A. D., Leroy, A. K., et al. 2020, ApJ, 903, 50 [NASA ADS] [CrossRef] [Google Scholar]
- Event Horizon Telescope Collaboration (Akiyama, K., et al.) 2019, ApJ, 875, L1 [Google Scholar]
- Event Horizon Telescope Collaboration (Akiyama, K., et al.) 2021, ApJ, 910, L12 [Google Scholar]
- Fender, R. P. 2001, MNRAS, 322, 31 [NASA ADS] [CrossRef] [Google Scholar]
- Filippenko, A. V., & Foley, R. J. 2005, IAU Circ., 8484, 2 [NASA ADS] [Google Scholar]
- Geach, J. E., Lopez-Rodriguez, E., Doherty, M. J., et al. 2023, Nature, 621, 483 [NASA ADS] [CrossRef] [Google Scholar]
- GRAVITY Collaboration (Abuter, R., et al.) 2019, A&A, 625, L10 [NASA ADS] [CrossRef] [EDP Sciences] [Google Scholar]
- Gray, A. D., Nicholls, J., Ekers, R. D., & Cram, L. E. 1995, ApJ, 448, 164 [NASA ADS] [CrossRef] [Google Scholar]
- Greenhill, L. J., Moran, J. M., & Herrnstein, J. R. 1997, ApJ, 481, L23 [Google Scholar]
- Henkel, C., Mühle, S., Bendo, G., et al. 2018, A&A, 615, A155 [NASA ADS] [CrossRef] [EDP Sciences] [Google Scholar]
- Heywood, I., Rammala, I., Camilo, F., et al. 2022, ApJ, 925, 165 [NASA ADS] [CrossRef] [Google Scholar]
- Hodge, J. A., & da Cunha, E. 2020, R. Soc. Open Sci., 7, 200556 [NASA ADS] [CrossRef] [Google Scholar]
- Humphreys, E. M. L., Vlemmings, W. H. T., Impellizzeri, C. M. V., et al. 2016, A&A, 592, L13 [NASA ADS] [CrossRef] [EDP Sciences] [Google Scholar]
- Hunter, T. R., Indebetouw, R., Brogan, C. L., et al. 2023, PASP, 135, 074501 [NASA ADS] [CrossRef] [Google Scholar]
- Kalberla, P. M. W., Burton, W. B., Hartmann, D., et al. 2005, A&A, 440, 775 [NASA ADS] [CrossRef] [EDP Sciences] [Google Scholar]
- Karachentsev, I. D., Tully, R. B., Dolphin, A., et al. 2007, AJ, 133, 504 [NASA ADS] [CrossRef] [Google Scholar]
- Kawamuro, T., Ricci, C., Imanishi, M., et al. 2022, ApJ, 938, 87 [NASA ADS] [CrossRef] [Google Scholar]
- Kawamuro, T., Ricci, C., Mushotzky, R. F., et al. 2023, ApJS, 269, 24 [NASA ADS] [CrossRef] [Google Scholar]
- Koss, M. J., Ricci, C., Trakhtenbrot, B., et al. 2022, ApJS, 261, 2 [NASA ADS] [CrossRef] [Google Scholar]
- Kravchenko, E. V., Cotton, W. D., Yusef-Zadeh, F., & Kovalev, Y. Y. 2016, MNRAS, 458, 4456 [Google Scholar]
- Lakićević, M., Zanardo, G., van Loon, J. T., et al. 2012, A&A, 541, L2 [NASA ADS] [CrossRef] [EDP Sciences] [Google Scholar]
- Laor, A., & Behar, E. 2008, MNRAS, 390, 847 [NASA ADS] [CrossRef] [Google Scholar]
- Laskar, T., Alexander, K. D., Berger, E., et al. 2018, ApJ, 862, 94 [NASA ADS] [CrossRef] [Google Scholar]
- Laskar, T., Alexander, K. D., Gill, R., et al. 2019, ApJ, 878, L26 [NASA ADS] [CrossRef] [Google Scholar]
- Lenc, E., & Tingay, S. J. 2009, AJ, 137, 537 [Google Scholar]
- Leroy, A. K., Schinnerer, E., Hughes, A., et al. 2021, ApJS, 257, 43 [NASA ADS] [CrossRef] [Google Scholar]
- Lipovetsky, V. A., Neizvestny, S. I., & Neizvestnaya, O. M. 1988, Soobshch. Spets. Astrofiz. Obs., 55, 5 [Google Scholar]
- Liu, K., Desvignes, G., Eatough, R. P., et al. 2021, ApJ, 914, 30 [NASA ADS] [CrossRef] [Google Scholar]
- Macías-Pérez, J. F., Mayet, F., Aumont, J., & Désert, F. X. 2010, ApJ, 711, 417 [NASA ADS] [CrossRef] [Google Scholar]
- Maron, O., Kijak, J., Kramer, M., & Wielebinski, R. 2000, A&AS, 147, 195 [NASA ADS] [CrossRef] [EDP Sciences] [Google Scholar]
- Martí, J., Bujalance-Fernández, I., Luque-Escamilla, P. L., et al. 2018, A&A, 619, A40 [NASA ADS] [CrossRef] [EDP Sciences] [Google Scholar]
- Mignani, R. P., Paladino, R., Rudak, B., et al. 2017, ApJ, 851, L10 [Google Scholar]
- Minter, A. H., Camilo, F., Ransom, S. M., Halpern, J. P., & Zimmerman, N. 2008, ApJ, 676, 1189 [Google Scholar]
- Monard, L. A. G., Milisavljevic, D., Fesen, R., et al. 2011, CBETs, 2946, 1 [Google Scholar]
- Montier, L., Plaszczynski, S., Levrier, F., et al. 2015a, A&A, 574, A135 [NASA ADS] [CrossRef] [EDP Sciences] [Google Scholar]
- Montier, L., Plaszczynski, S., Levrier, F., et al. 2015b, A&A, 574, A136 [NASA ADS] [CrossRef] [EDP Sciences] [Google Scholar]
- Mullaney, J. R., Alexander, D. M., Goulding, A. D., & Hickox, R. C. 2011, MNRAS, 414, 1082 [Google Scholar]
- Ou, P.-S., Chu, Y.-H., Maggi, P., et al. 2018, ApJ, 863, 137 [Google Scholar]
- Panagia, N., Gilmozzi, R., Macchetto, F., Adorf, H. M., & Kirshner, R. P. 1991, ApJ, 380, L23 [NASA ADS] [CrossRef] [Google Scholar]
- Parlanti, E., Carniani, S., Pallottini, A., et al. 2023, A&A, 673, A153 [NASA ADS] [CrossRef] [EDP Sciences] [Google Scholar]
- Ricci, C., Ueda, Y., Koss, M. J., et al. 2015, ApJ, 815, L13 [Google Scholar]
- Ricci, C., Trakhtenbrot, B., Koss, M. J., et al. 2017, ApJS, 233, 17 [Google Scholar]
- Ricci, C., Chang, C.-S., Kawamuro, T., et al. 2023, ApJ, 952, L28 [NASA ADS] [CrossRef] [Google Scholar]
- Ritacco, A., Macías-Pérez, J. F., Ponthieu, N., et al. 2018, A&A, 616, A35 [NASA ADS] [CrossRef] [EDP Sciences] [Google Scholar]
- Roy, A. L., Oosterloo, T., Goss, W. M., & Anantharamaiah, K. R. 2010, A&A, 517, A82 [NASA ADS] [CrossRef] [EDP Sciences] [Google Scholar]
- Rybak, M., Sluse, D., Gupta, K. K., et al. 2025, A&A, 701, A215 [NASA ADS] [CrossRef] [EDP Sciences] [Google Scholar]
- Shablovinskaia, E., Ricci, C., Paladino, R., et al. 2025, A&A, in press, https://doi.org/10.1051/0004-6361/202555796 [Google Scholar]
- Shablovinskaya, E., Ricci, C., Chang, C. S., et al. 2024, A&A, 690, A232 [NASA ADS] [CrossRef] [EDP Sciences] [Google Scholar]
- Smit, R., Bouwens, R. J., Carniani, S., et al. 2018, Nature, 553, 178 [Google Scholar]
- Stephens, I. W., Lin, Z.-Y. D., Fernández-López, M., et al. 2023, Nature, 623, 705 [NASA ADS] [CrossRef] [Google Scholar]
- Torne, P. 2018, in Pulsar Astrophysics the Next Fifty Years, eds. P. Weltevrede, B. B. P. Perera, L. L. Preston, & S. Sanidas, IAU Symposium, 337, 92 [Google Scholar]
- Torne, P., Eatough, R. P., Karuppusamy, R., et al. 2015, MNRAS, 451, L50 [Google Scholar]
- Torne, P., Desvignes, G., Eatough, R. P., et al. 2017, MNRAS, 465, 242 [Google Scholar]
- Tucci, M., Toffolatti, L., de Zotti, G., & Martínez-González, E. 2011, A&A, 533, A57 [NASA ADS] [CrossRef] [EDP Sciences] [Google Scholar]
- Vidal, M., Dickinson, C., Davies, R. D., & Leahy, J. P. 2015, MNRAS, 452, 656 [NASA ADS] [CrossRef] [Google Scholar]
- Yusef-Zadeh, F., Morris, M., & Chance, D. 1984, Nature, 310, 557 [NASA ADS] [CrossRef] [Google Scholar]
Appendix A: Region of moderate mm polarization
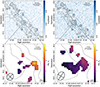 |
Fig. A.1. ALMA observations of NGC 4945 on 11 October 2023 (S1, left column) and on 25 October 2023 (S2, right column). Upper panel: polarized intensity with the overplotted total intensity contours corresponding to the 0.07, 0.19, 0.31, 0.54 mJy/beam levels in the box ∼5×5″. Bottom panel: polarization degree in per cent in the box of ∼0.6×0.6″. The orientation of the polarization vector is given with gray ticks. |
All Tables
ALMA Band 3 fluxes and the spectral index of the highly polarized mm source in NGC 4945 for epochs S1 (2023–10–11) and S2 (2023–10–25).
All Figures
|
Fig. 1. ALMA observations of NGC 4945 on 11 October 2023 (S1, left column) and on 25 October 2023 (S2, right column). Upper panel: Total intensity with the contours corresponding to the 0.07, 0.19, 0.31, and 0.54 mJy/beam levels in the box ∼10 × 10″. The location of the AGN is marked with a red cross. Middle panel: Polarized intensity. The total intensity contours are overplotted. Bottom panel: Polarization degree in percent in the box of ∼0.5 × 0.5″. The orientation of the polarization vector is given with black ticks. |
| In the text | |
|
Fig. 2. ALMA observations of the Punctum in different epochs. Due to the low resolution on 11 July 2021, only upper limits are given. The 3σ ∼ 0.05 mJy level for S1 and S2 epochs is given as the dotted black line. |
| In the text | |
|
Fig. A.1. ALMA observations of NGC 4945 on 11 October 2023 (S1, left column) and on 25 October 2023 (S2, right column). Upper panel: polarized intensity with the overplotted total intensity contours corresponding to the 0.07, 0.19, 0.31, 0.54 mJy/beam levels in the box ∼5×5″. Bottom panel: polarization degree in per cent in the box of ∼0.6×0.6″. The orientation of the polarization vector is given with gray ticks. |
| In the text | |
Current usage metrics show cumulative count of Article Views (full-text article views including HTML views, PDF and ePub downloads, according to the available data) and Abstracts Views on Vision4Press platform.
Data correspond to usage on the plateform after 2015. The current usage metrics is available 48-96 hours after online publication and is updated daily on week days.
Initial download of the metrics may take a while.