Fig. 3.
Download original image
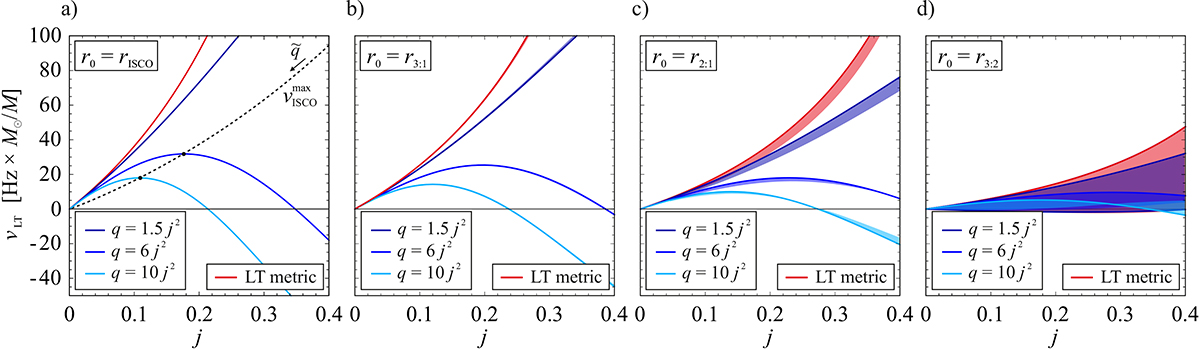
LT precession frequency in LT and HT spacetimes. a) At the ISCO. b) Close to the ISCO. c) Close to the location of the maximum of the geodesic radial epicyclic frequency. d) At a larger radius, outside of the location of the maximum of the geodesic radial epicyclic frequency. The LT metric is shown in red. Lines in shades of blue correspond to the HT metric with varying q. The solid lines show the frequencies relevant to the test particle motion and slender tori. The colour-shaded regions indicate frequencies relevant to non-geodetic flows and cover all allowable torus thicknesses. The dotted line in panel a denotes the maximum frequency at the ISCO given by equation (14).
Current usage metrics show cumulative count of Article Views (full-text article views including HTML views, PDF and ePub downloads, according to the available data) and Abstracts Views on Vision4Press platform.
Data correspond to usage on the plateform after 2015. The current usage metrics is available 48-96 hours after online publication and is updated daily on week days.
Initial download of the metrics may take a while.