Fig. 4.
Download original image
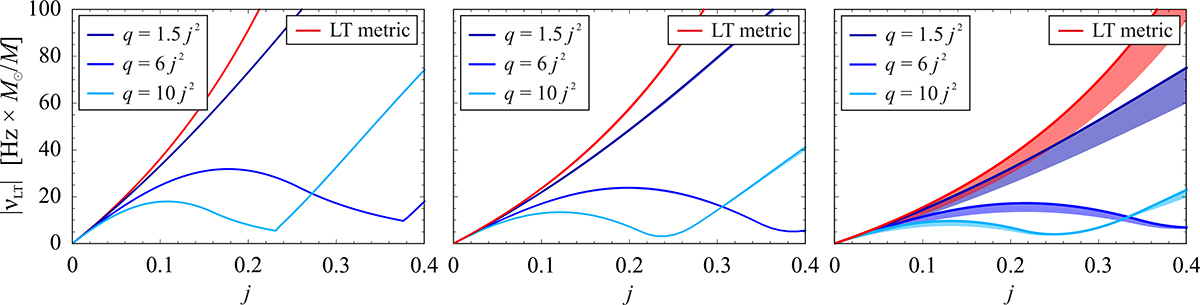
Maximum and average value of the LT frequency. Left panel: Maximum of the frequency, νMAX, as a function of the angular momentum of the star. Middle panel: Frequency value averaged from rISCO to r2 : 1 as a function of the star’s angular momentum. Right panel: Frequency averaged from rISCO to r3 : 2 as a function of the star’s angular momentum. As in Figure 3, the red lines correspond to the LT metric, while the lines in shades of blue correspond to the HT metric and varying q. The shaded regions indicate the frequencies relevant to non-geodetic flows and cover the full range of allowable torus thicknesses.
Current usage metrics show cumulative count of Article Views (full-text article views including HTML views, PDF and ePub downloads, according to the available data) and Abstracts Views on Vision4Press platform.
Data correspond to usage on the plateform after 2015. The current usage metrics is available 48-96 hours after online publication and is updated daily on week days.
Initial download of the metrics may take a while.