Fig. 5.
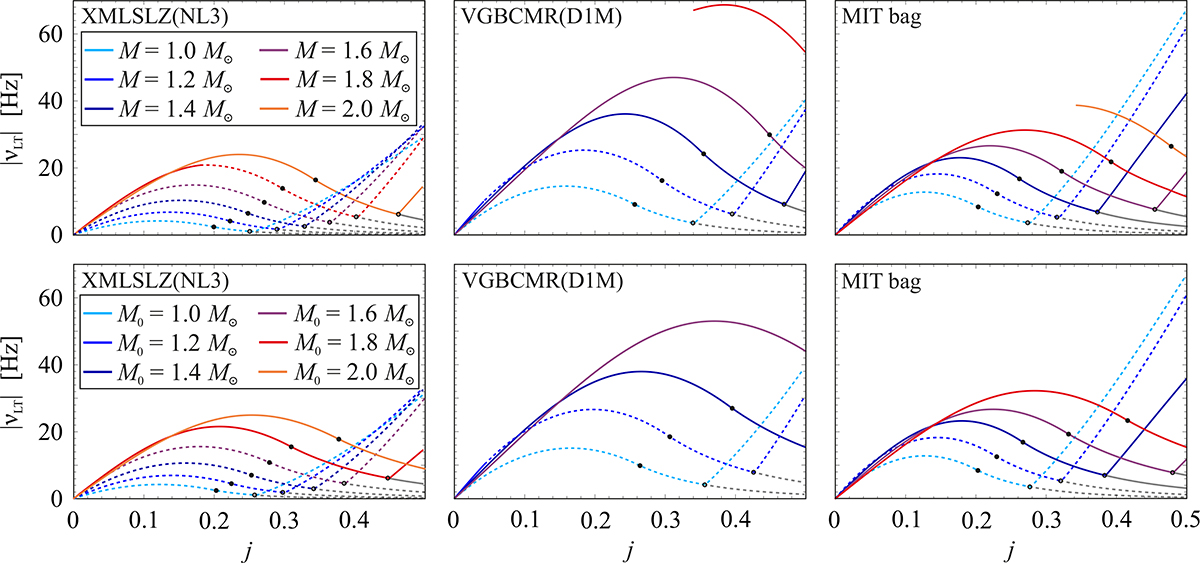
Download original image
Maximum LT precession frequency as a function of angular momentum of the star based on a specific EoS and a fixed gravitational mass, M (top panels), or a fixed non-rotating mass, M0 (bottom panels). Left panels: XMLSLZ(NL3) EoS. Middle panels: VGBCMR(D1M) EoS. Right panels: MIT bag EoS. The coloured solid lines show the values of νMAX when the star’s surface is below the ISCO, while the coloured dashed lines show the values of νMAX when the surface is above the ISCO. The circles on the individual lines enable us to determine the radius at which the maximum displayed frequency is reached. For values of j below that indicated by the black filled circle (or when there is no circle), the frequency corresponds to the edge of the relevant radial interval: the ISCO (solid lines) or the NS surface (dotted lines). For higher values of j, below the value indicated by the open circle, the frequency corresponds to the maximum above the edge. Above this value, it again corresponds to the ISCO for the solid lines and the NS surface for the dotted lines. The grey lines then indicate the value of the corresponding local geodesic maximum, νmax0.
Current usage metrics show cumulative count of Article Views (full-text article views including HTML views, PDF and ePub downloads, according to the available data) and Abstracts Views on Vision4Press platform.
Data correspond to usage on the plateform after 2015. The current usage metrics is available 48-96 hours after online publication and is updated daily on week days.
Initial download of the metrics may take a while.