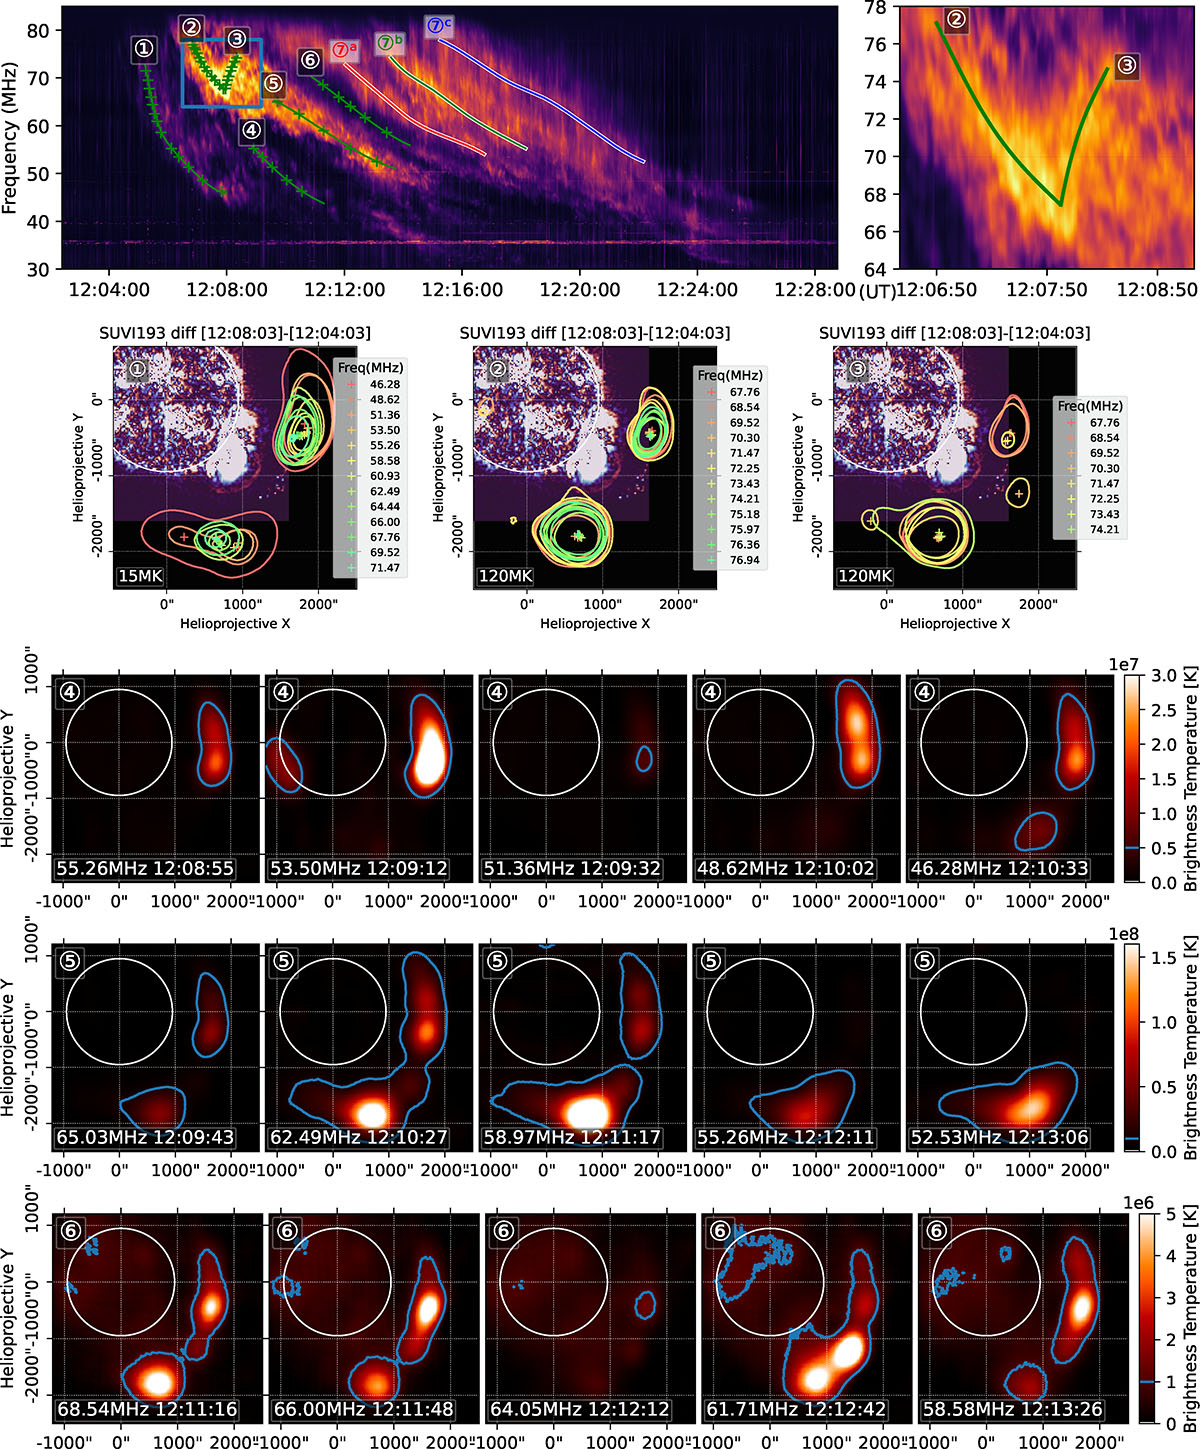
Fig. 3.
Download original image
Overview of the type II radio burst lanes observed with LOFAR LBA. Top-left panel: Dynamic spectrum in the frequency range 30−88 MHz. Seven different lanes along the radio burst are numbered, and a series of green points indicate the frequency and times of the observations presented in the lower panels. Lanes 1 and 2 show the initial double source structure, while region 3 marks the appearance of a third distinct emission source. These lanes are plotted with the relative EUV running difference emission to put the radio source in context with the driving front. Lower panels: LOFAR radio imaging of lanes 1–6, showing the spatial distribution of each emission feature. In the top row, the contours of the radio sources are color-coded by frequency (see the legend). The contours represent a brightness temperature of 15 MK for lane 1 and 120 MK for lanes 2 and 3. Lanes 4 and 5 show emission with varying spatial distributions. Lane 6 shows emission comparable to the quiet-Sun level. Lanes 7a–c, appearing later in time, represent harmonic emission and are parallel. Lanes 1 and 2 show similar source locations, with double source structures on the western and southern sides of the shock front. Lane 3 shows the moment where the third source starts to appear; the top-right panel shows a zoomed-in view of the spectrum at this moment, with the appearance of other lanes in the spectrum and the presence of a third source in the imaging. Lane 4 shows emission predominantly on the western side, while lane 5 exhibits complex structures in both the western and southern regions. Detailed imaging of the three parallel harmonic lanes 7a–c is presented in Figs. 4 and 5.
Current usage metrics show cumulative count of Article Views (full-text article views including HTML views, PDF and ePub downloads, according to the available data) and Abstracts Views on Vision4Press platform.
Data correspond to usage on the plateform after 2015. The current usage metrics is available 48-96 hours after online publication and is updated daily on week days.
Initial download of the metrics may take a while.