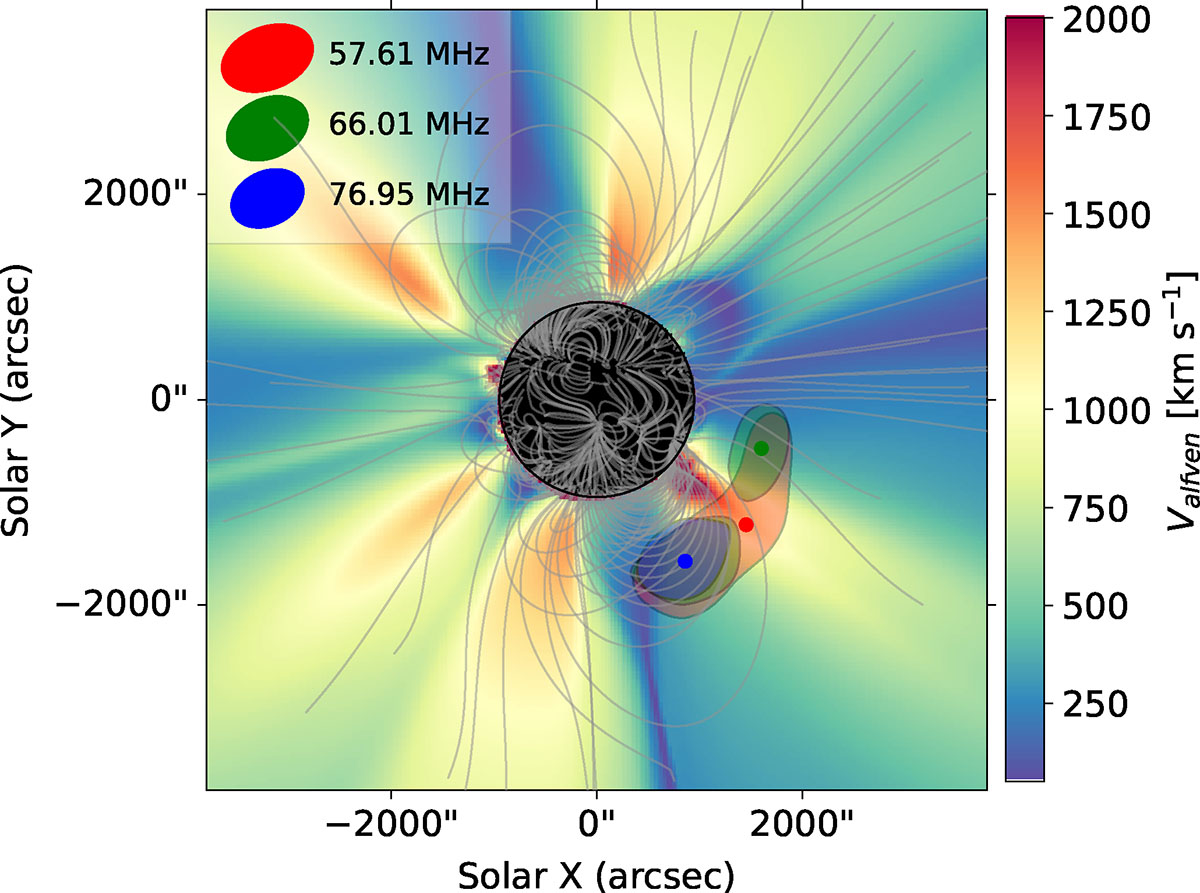
Fig. 5.
Download original image
LOFAR radio imaging of the multilane structure, over a background color map representing the coronal Alfvén speed from the Predictive Science MHD model (Riley et al. 2011). Radio contours (80% level) and centroids are shown as in Fig. 4. The dynamic spectrum and lane colors (blue, green, and red) match those in the previous figure. Notably, the central (red) radio source is located in a region of higher Alfvén speed.
Current usage metrics show cumulative count of Article Views (full-text article views including HTML views, PDF and ePub downloads, according to the available data) and Abstracts Views on Vision4Press platform.
Data correspond to usage on the plateform after 2015. The current usage metrics is available 48-96 hours after online publication and is updated daily on week days.
Initial download of the metrics may take a while.