Fig. 6.
Download original image
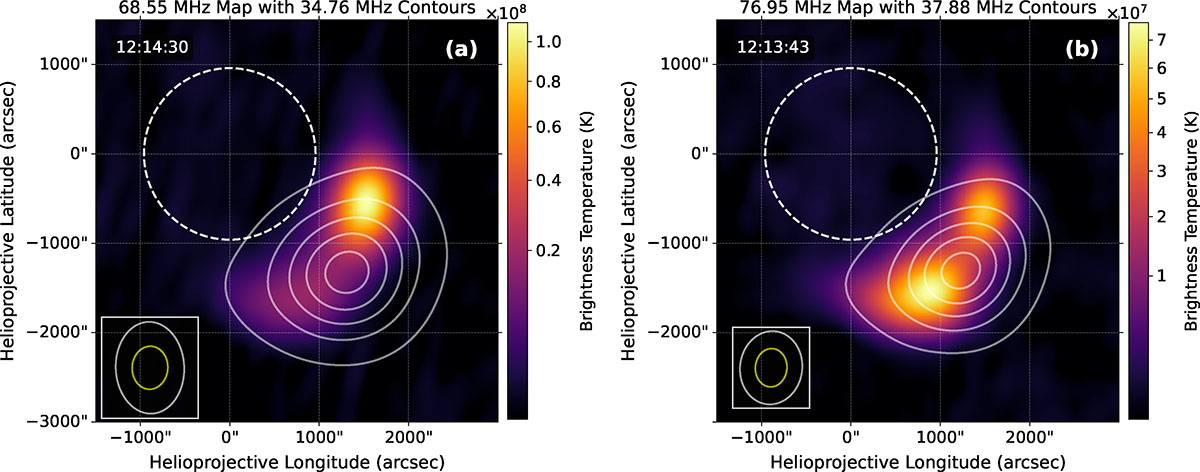
LOFAR images showing the locations of F and H emission sources for two F–H pairs. The white contours, drawn at 0.1, 0.3, 0.5, 0.7, and 0.9 of the peak brightness temperature, represent the F emission, while the colored intensity (displayed with a square-root color scale, as indicated in the colorbar) corresponds to the H emission. The optical solar disk is shown as a dashed white circle. The white and yellow ellipses in the bottom-left corners indicate the restoring beams for the F and H maps, respectively. In both pairs, the F and H centroids are co-spatial within the LOFAR beam; however, the H emission is clearly resolved into two distinct components, whereas the F appears more extended and blended, likely due to the lower spatial resolution and stronger propagation effects at the F frequency.
Current usage metrics show cumulative count of Article Views (full-text article views including HTML views, PDF and ePub downloads, according to the available data) and Abstracts Views on Vision4Press platform.
Data correspond to usage on the plateform after 2015. The current usage metrics is available 48-96 hours after online publication and is updated daily on week days.
Initial download of the metrics may take a while.