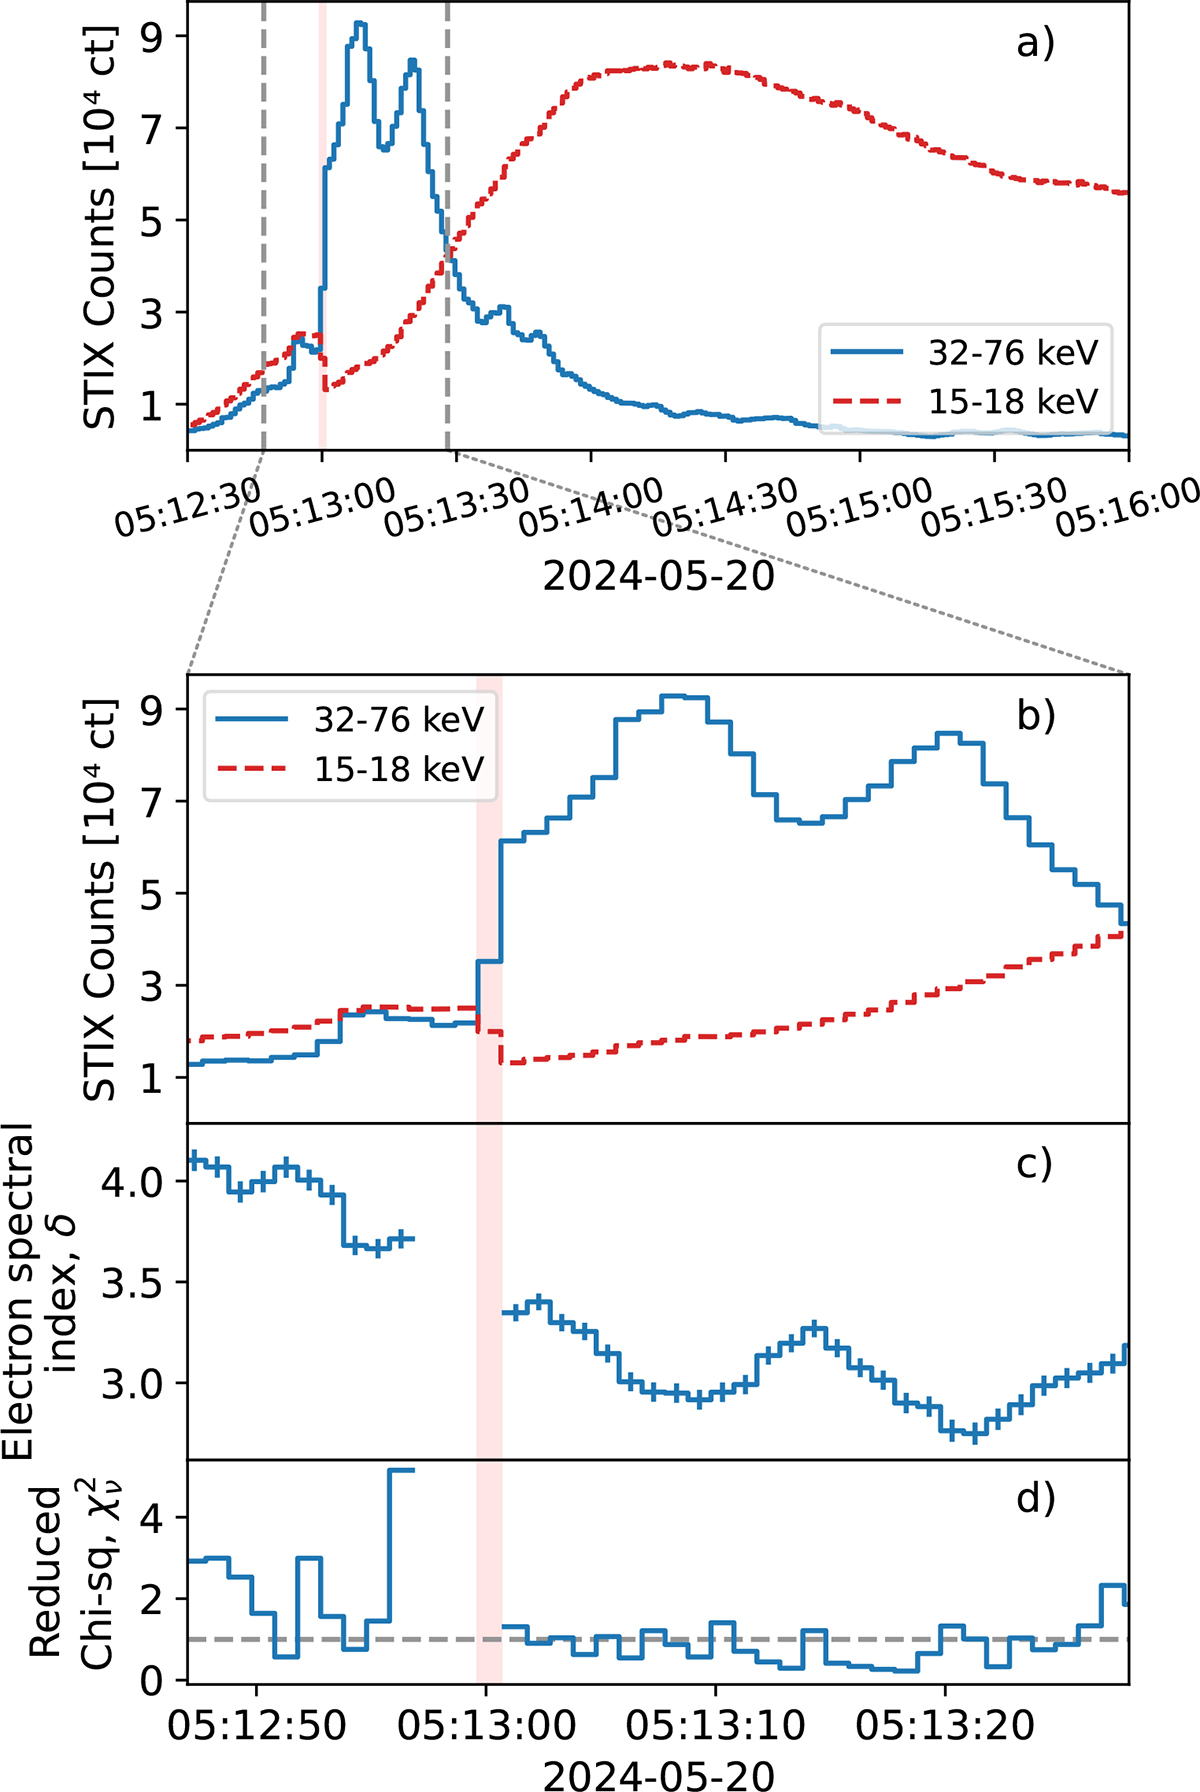
Fig. 2.
Download original image
Spectral evolution of the SOL2024-05-20T05:14L171C109 (estimated-X16.5) solar flare as a function of time (light arrival time at Solar Orbiter). All time bins are 1 s. a) and b) Thermal (red dashed; 15–18 keV) and non-thermal (blue solid; 32–76 keV) raw, uncorrected STIX counts summed over the 24 coarsest imaging sub-collimators (10a, 10b, 10c,…,3a, 3b and 3c). Two large non-thermal peaks are seen. The attenuator (inserted during the red time bin) absorbs few photons above 32 keV, but the increased detector live-time enabled by the reduction of lower energy counts caused those measured at 32–76 keV to increase. The grey vertical dashed lines in panel a) show the impulsive phase, which corresponds to the time axes of subsequent panels (and Fig. B.1). c) and d) Spatially averaged electron spectral index (panel c) and reduced χ2 statistics (panel d) obtained from fits to STIX spectra. The error bars represent the 1σ uncertainties. The response during the attenuator motion is uncertain, and the observations during the prior 3 seconds may have been compromised by increased pile-up. Consequently, we do not show fitting results for these times.
Current usage metrics show cumulative count of Article Views (full-text article views including HTML views, PDF and ePub downloads, according to the available data) and Abstracts Views on Vision4Press platform.
Data correspond to usage on the plateform after 2015. The current usage metrics is available 48-96 hours after online publication and is updated daily on week days.
Initial download of the metrics may take a while.