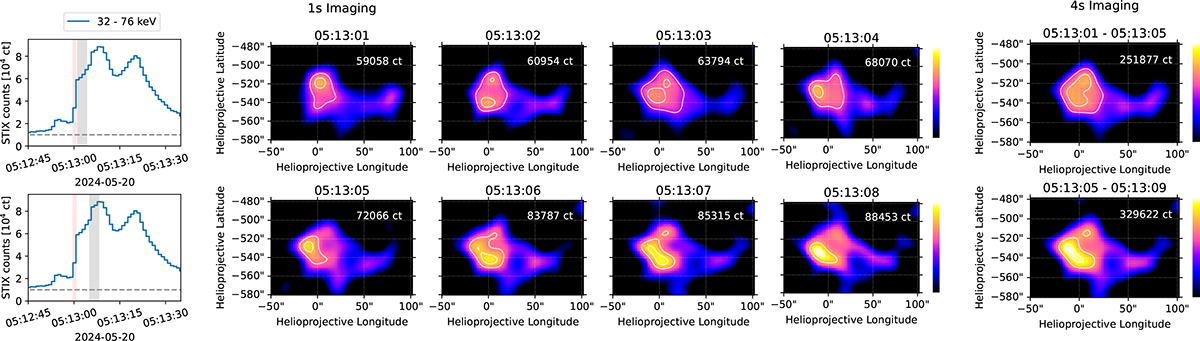
Fig. 3.
Download original image
STIX non-thermal images of the SOL2024-05-20T05:14L171C109 (estimated-X16.5) flare over the spectral range 32–76 keV and time interval 05:13:01–05:13:09 UT (light arrival time at Solar Orbiter). The images were constructed with the MEM_GE algorithm using the 24 coarsest imaging sub-collimators (10a, 10b, 10c,…,3a, 3b, 3c). Each row represents a sequential 4 s interval. Left column: Time series (blue) of the imaged counts, where each step represents 1 s. The grey region denotes the interval imaged in that row. The horizontal dashed line shows the 10 000 count level, and the red region denotes the time bin during which the attenuator was inserted. Middle 4 columns: Images with a 1 s integration time, progressing in time from left to right. The contours represent 40% and 80% of the peak flux in each image, and the colour table is scaled to be consistent across all 1 s images. The top right of each frame shows the number of counts used in each image. Right column: Images with a 4 s integration time corresponding to the same interval as the 1 s images in the same row. The contours and count labels are the same as in the middle rows, but the colour table is scaled across the 4 s images. It is not consistent with the 1 s images.
Current usage metrics show cumulative count of Article Views (full-text article views including HTML views, PDF and ePub downloads, according to the available data) and Abstracts Views on Vision4Press platform.
Data correspond to usage on the plateform after 2015. The current usage metrics is available 48-96 hours after online publication and is updated daily on week days.
Initial download of the metrics may take a while.