Fig. 4.
Download original image
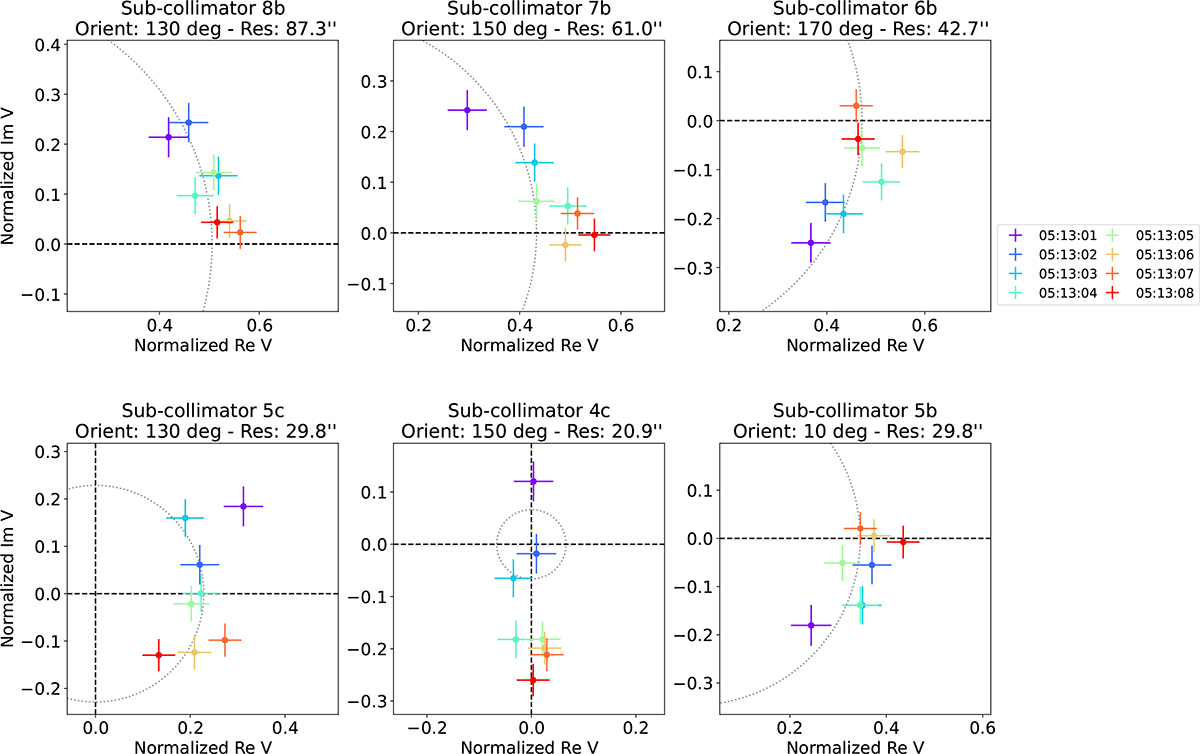
The real (x axes) and imaginary parts (y axes) of STIX relative visibilities calculated over the period 2024-05-20 05:13:01–05:13:09 and spectral range 32–76 keV. Each panel corresponds to one of the six sub-collimators whose relative visibilities varied most over these ranges. The colours represent the evolution over time (violet to red) at a cadence of 1 s. The title of each panel gives the label, orientation, and angular resolution of the relevant sub-collimator. The error bars represent the 1σ uncertainties. The black dashed lines represent the x = 0 and y = 0 lines. The grey circles centred at the origin help to emphasise the variations in the amplitudes and phases of the relative visibilities.
Current usage metrics show cumulative count of Article Views (full-text article views including HTML views, PDF and ePub downloads, according to the available data) and Abstracts Views on Vision4Press platform.
Data correspond to usage on the plateform after 2015. The current usage metrics is available 48-96 hours after online publication and is updated daily on week days.
Initial download of the metrics may take a while.