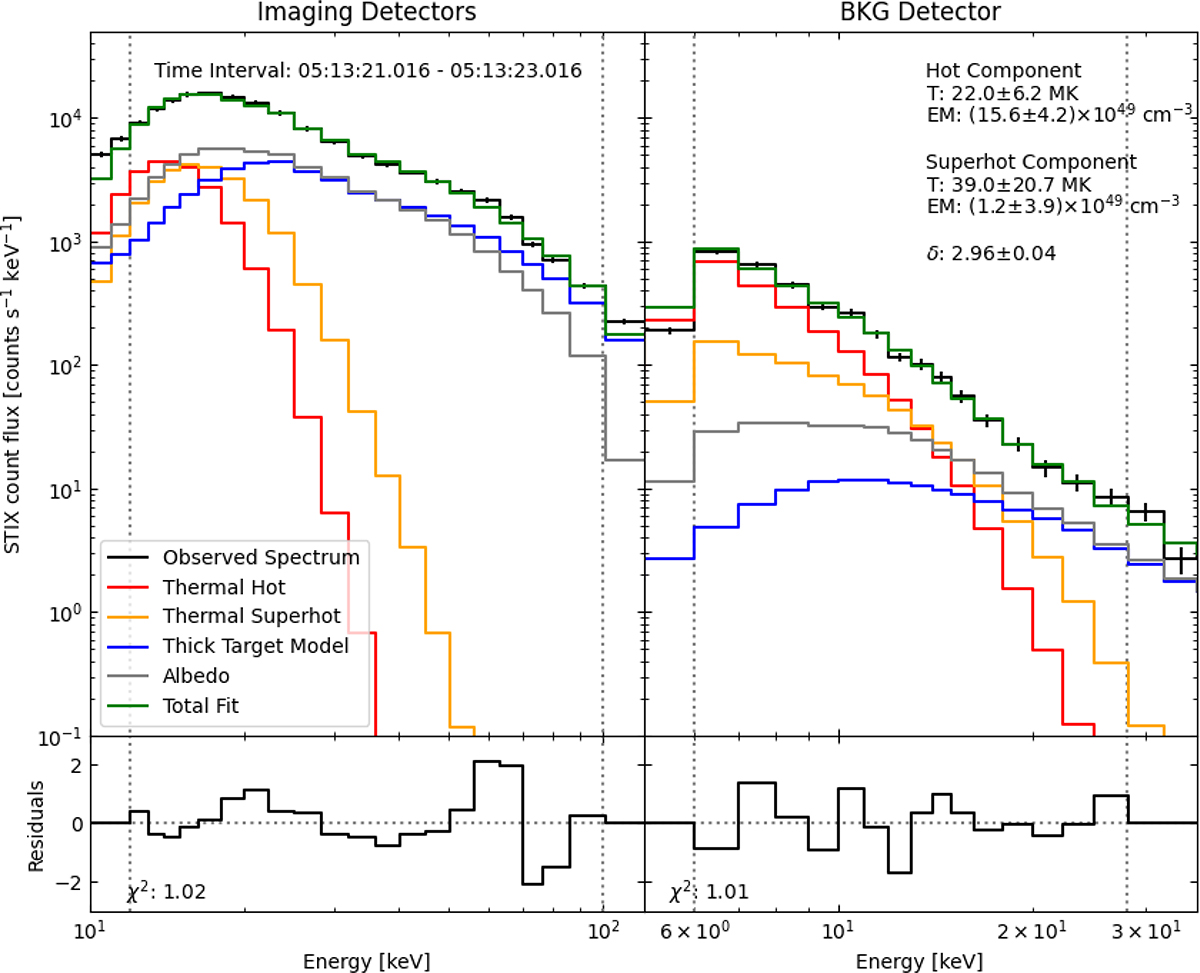
Fig. A.1.
Download original image
Observed STIX spectra (black) integrated over 2 s around the second large non-thermal peak of the SOL2024-05-20T05:14L171C109 (estimated-X16.5) flare (05:13:21 – 05:13:23). The summed spectra from the 24 coarsest angular resolution imaging sub-collimators (left) and pixels 2 and 5 of the background detector (BKG; right) are shown. The best fit (green) is derived by applying an iterative fitting method (Stiefel et al. 2025) to both spectra with a model including thermal (red), superhot thermal (yellow), non-thermal thick-target (blue), and albedo (grey) components. The fitted spectral ranges (12 – 100 keV for imaging detectors; 6 – 28 keV for the BKG detector) are denoted by the vertical dotted lines. The lower panels show the fit residuals, whose calculation included a 5% systematic error. The best-fit model parameters are given in the top right, along with their uncertainties.
Current usage metrics show cumulative count of Article Views (full-text article views including HTML views, PDF and ePub downloads, according to the available data) and Abstracts Views on Vision4Press platform.
Data correspond to usage on the plateform after 2015. The current usage metrics is available 48-96 hours after online publication and is updated daily on week days.
Initial download of the metrics may take a while.