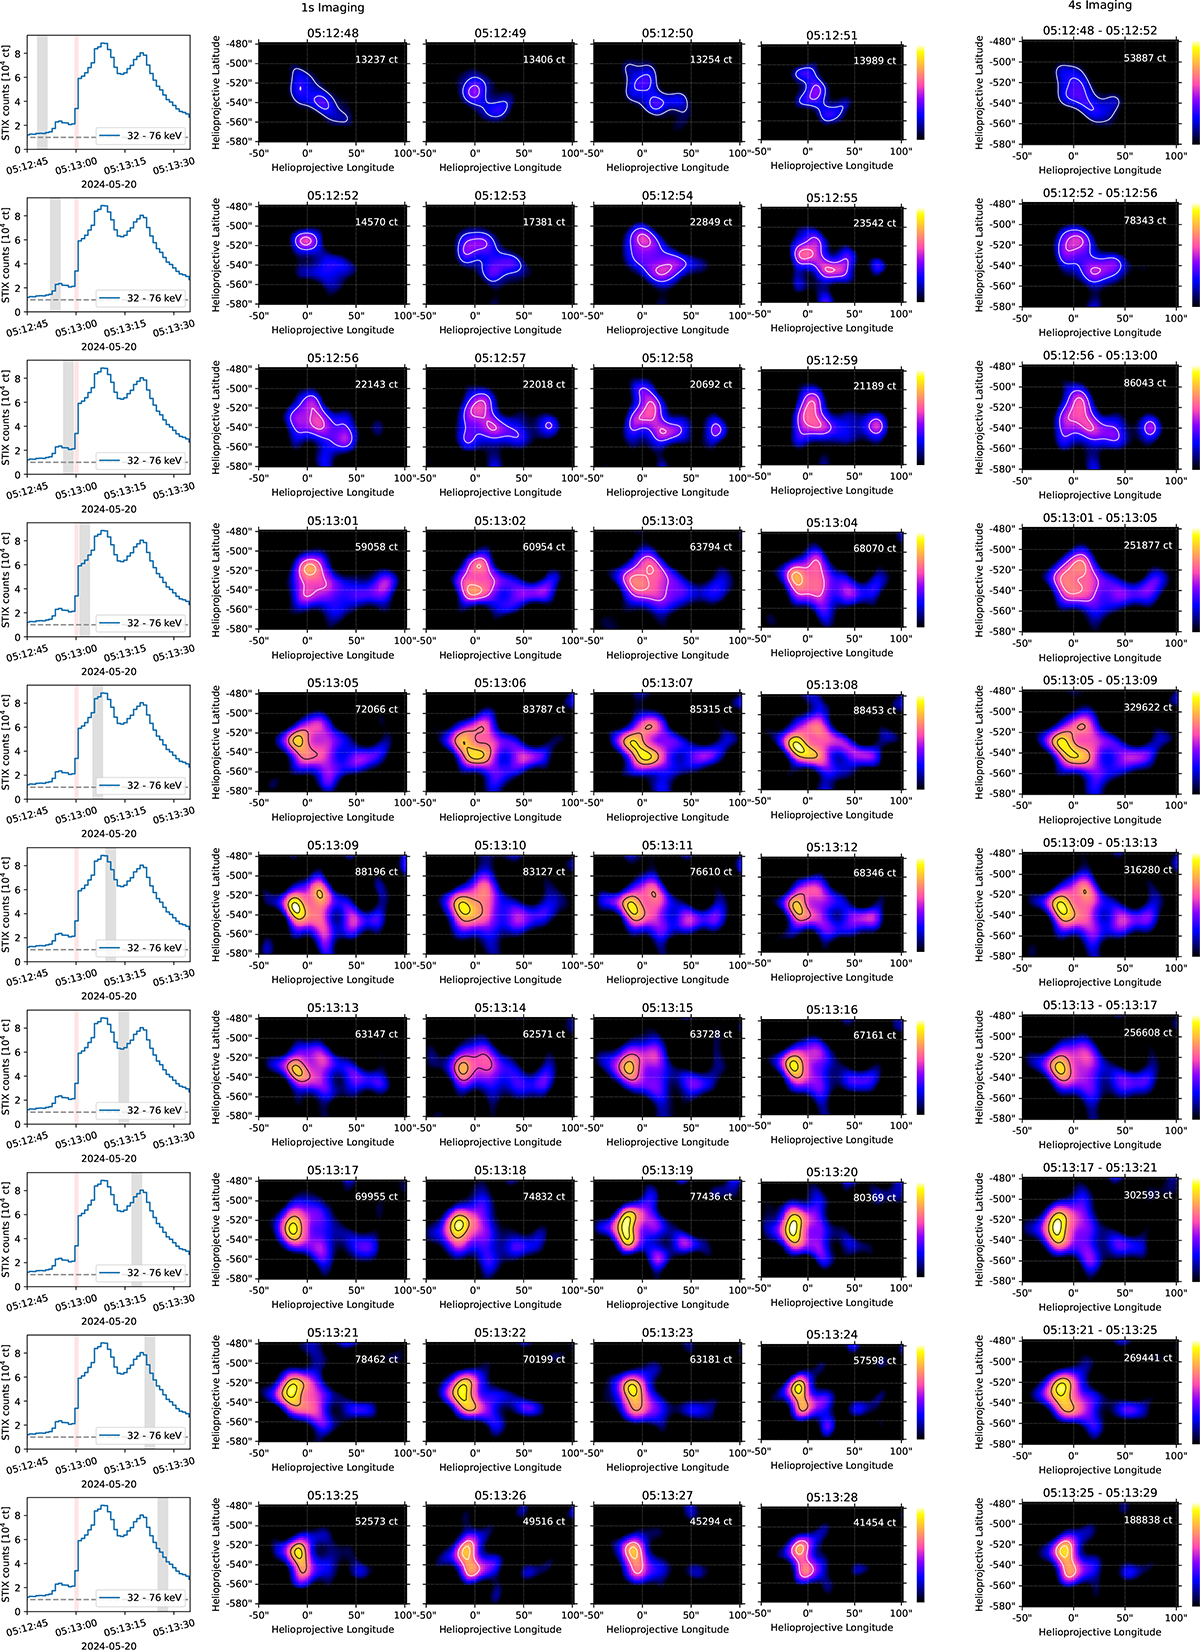
Fig. B.1.
Download original image
STIX MEM_GE non-thermal imaging results over the spectral range 32 – 76 keV during the rise phase of the SOL2024-05-20T05:14L171C109 (estimated-X16.5) flare. Left column: 32 – 76 keV integrated lightcurves. Grey regions show the 4 s interval imaged in each row. The red region shows the 1 s time bin encompassing the attenuator motion, during which images were not produced. Middle 4 columns: 1 s-integration images progressing in time from left to right, and then downward through each row. White/black lines show 40% and 80% contours relative to the peak intensity in each image. The colour table is scaled to be consistent across all 1 s images. The number of counts used for each image is given in the top right corner of each frame. Right column: 4 s-integration images corresponding to the same interval as the 1 s images in the same row. The contours and count labels are as in the middle rows, but the colour table is scaled across all 4 s images, and is not consistent with the 1 s images. Note that some rows show morphological changes on ≤1 s timescales that are not captured by the 4 s images.
Current usage metrics show cumulative count of Article Views (full-text article views including HTML views, PDF and ePub downloads, according to the available data) and Abstracts Views on Vision4Press platform.
Data correspond to usage on the plateform after 2015. The current usage metrics is available 48-96 hours after online publication and is updated daily on week days.
Initial download of the metrics may take a while.