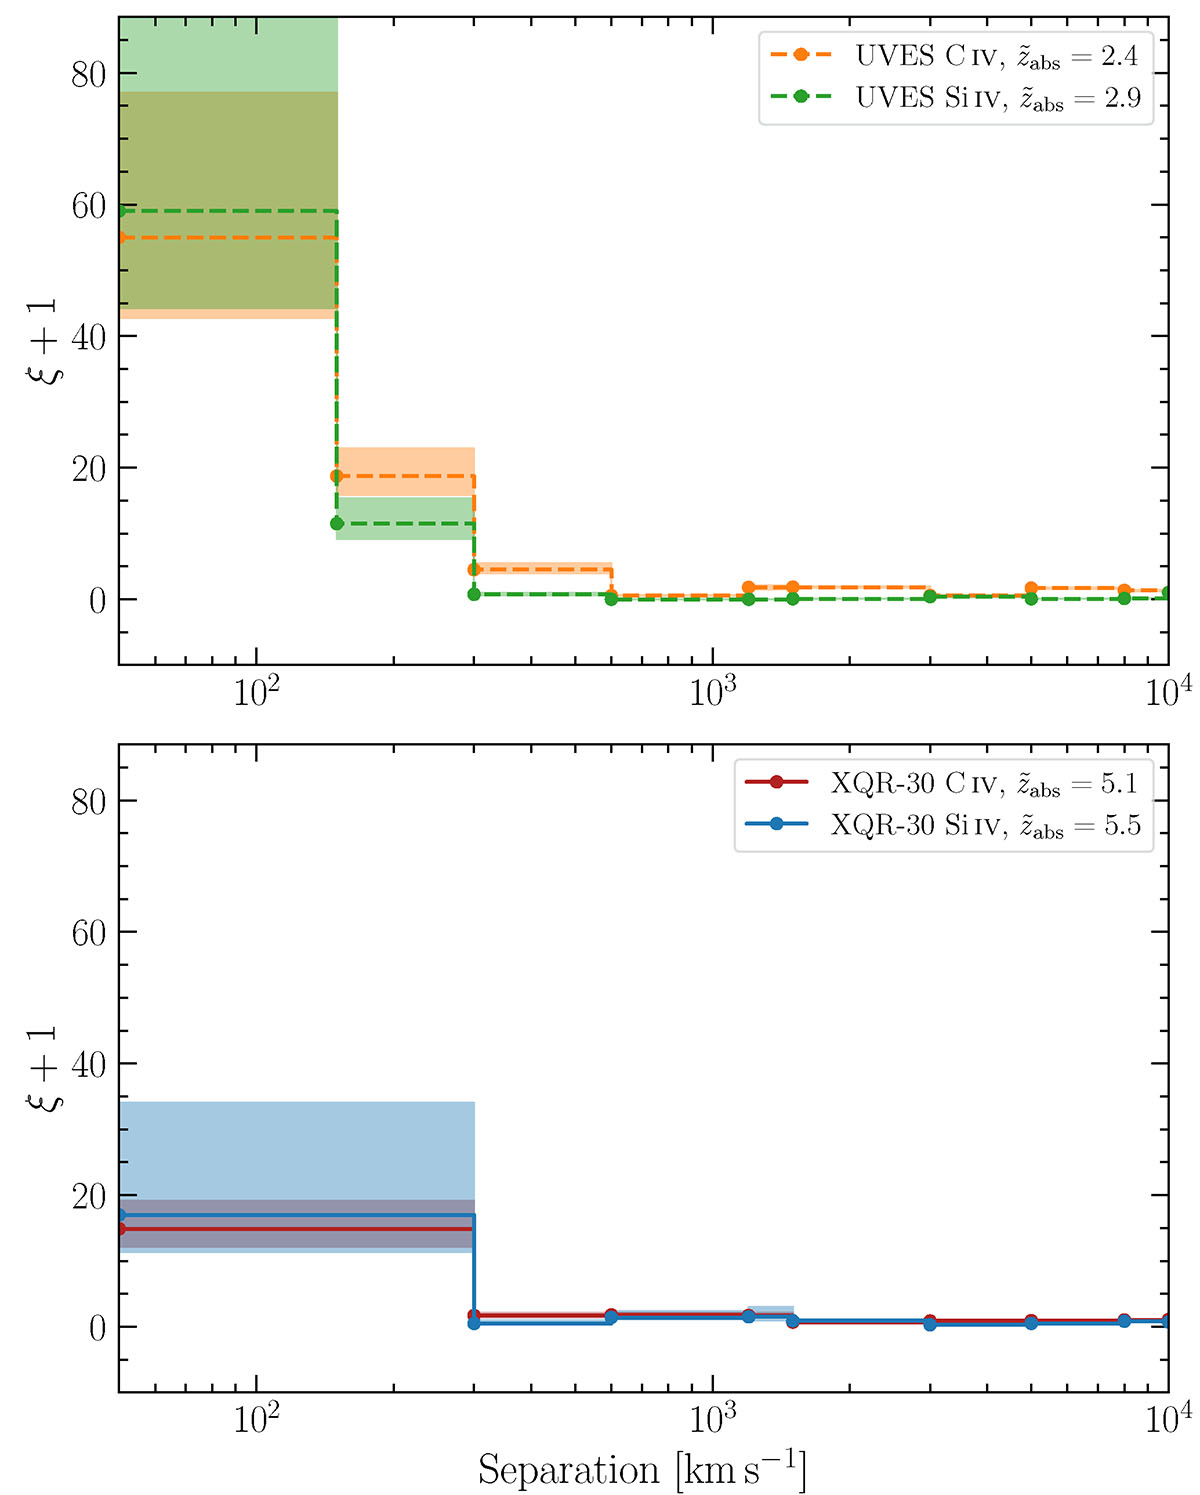
Fig. 2.
Download original image
Top: 2PCF of C IV and Si IV based on the UVES LP data analysed in D’Odorico et al. (2010, 2022). In this calculation we have imposed the same column density cuts as applied to the E-XQR-30 data. Compared to E-XQR-30, the resulting distributions are sampled more frequently, with an additional evaluation point at Δv = 150 km s−1. The subsequent bins are consistent with those used for XQR-30. Bottom: 2PCF of C IV and Si IV shown on the smallest scale accessible based on the limited statistics of the Si IV data. The first five bins span Δv = [50 − 300, 300 − 600, 600 − 1200, 1200 − 1500, 1500 − 3000] km s−1. Note that distributions of ξ values are formed via many realisations of the randomly distributed lines. For each sample, the solid line represents the median value and the shaded region encompasses the interquartile range.
Current usage metrics show cumulative count of Article Views (full-text article views including HTML views, PDF and ePub downloads, according to the available data) and Abstracts Views on Vision4Press platform.
Data correspond to usage on the plateform after 2015. The current usage metrics is available 48-96 hours after online publication and is updated daily on week days.
Initial download of the metrics may take a while.