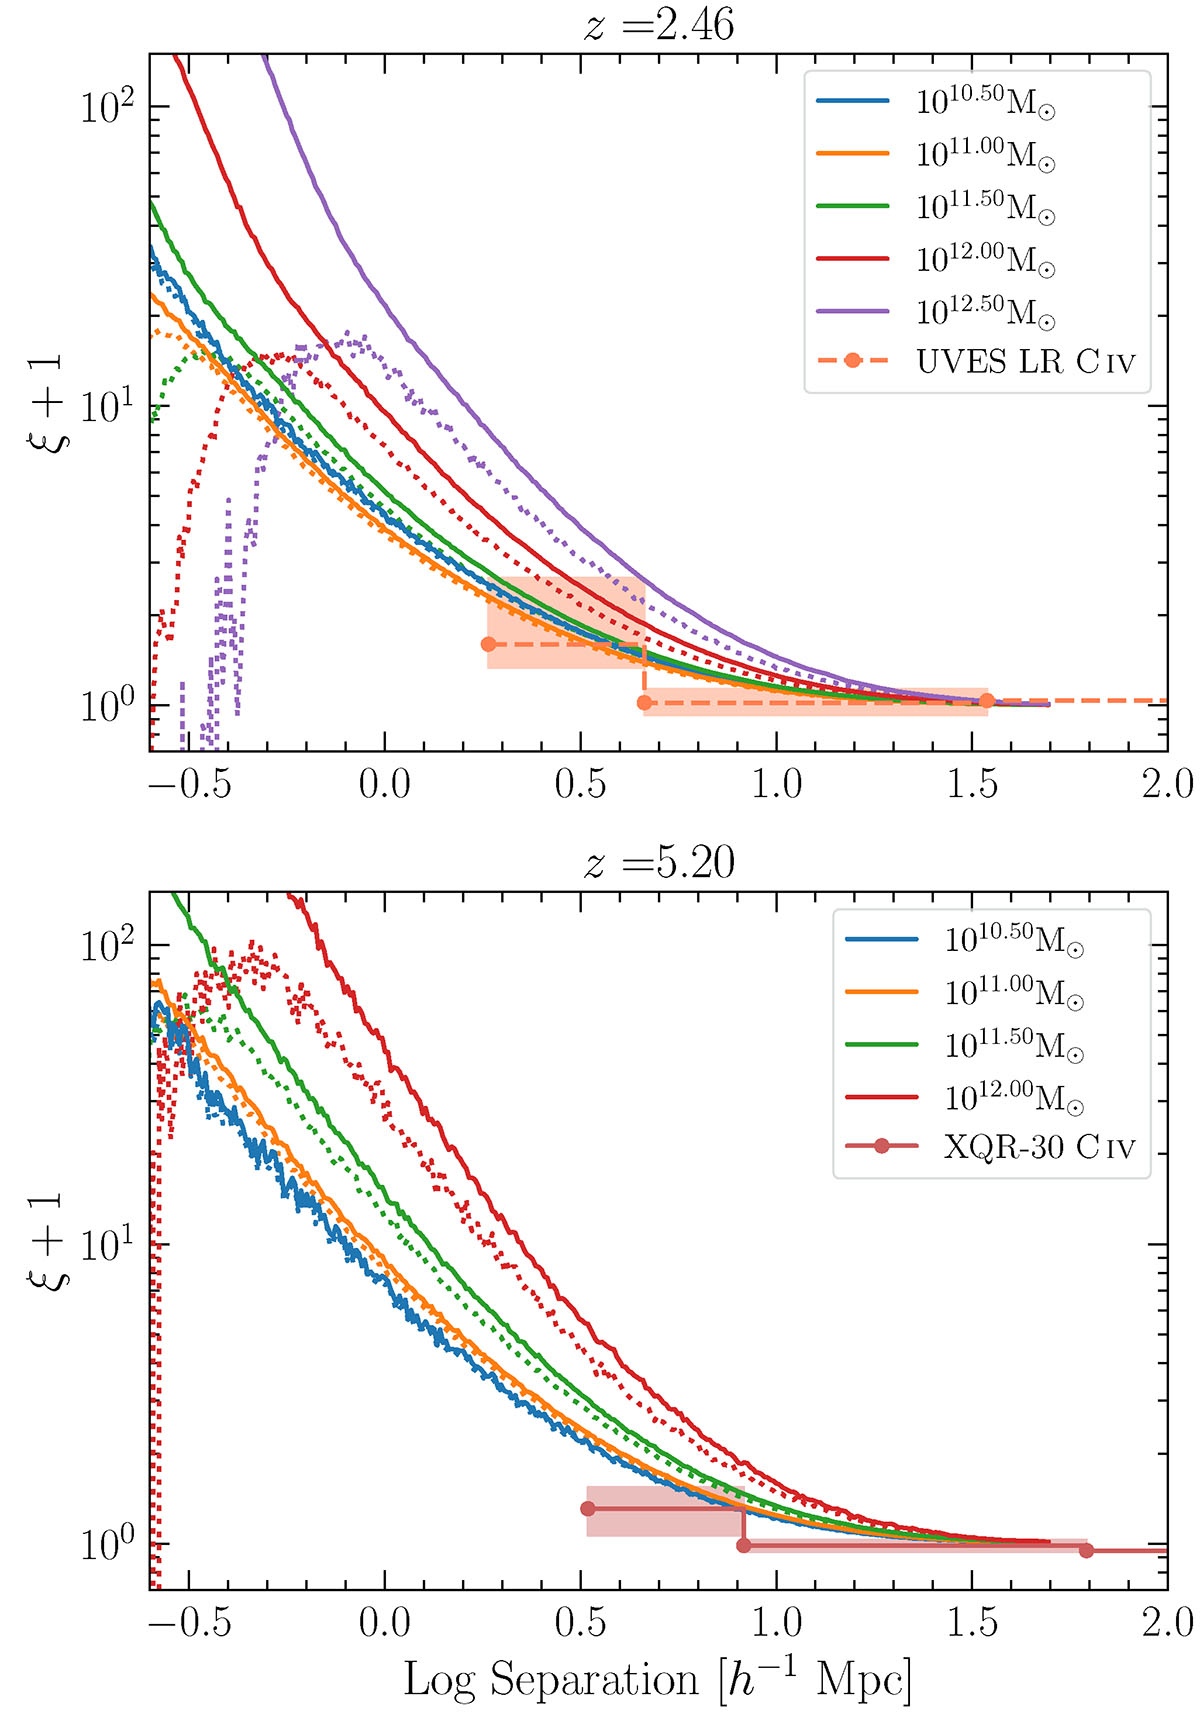
Fig. 5.
Download original image
3D real space correlation calculated at different epochs using the GAEA simulation suite snapshots. The correlation is calculated using the CORRFUNC package. The different colours correspond to galaxies with different virial parent halo masses. The top and bottom panels correspond to different epochs, as indicated by the titles. The solid curves represent the clustering of all galaxies in the snapshot. The dotted lines represent that of only the central galaxies associated with halos. The observed 2PCFs of C IV and Si IV have been overplotted on these simulation data across different epochs. In this case, we calculated the 2PCF of C IV systems (i.e. all the absorption within 200 km s−1 is considered one feature). Again, the shaded regions correspond to the interquartile range of the observed distributions.
Current usage metrics show cumulative count of Article Views (full-text article views including HTML views, PDF and ePub downloads, according to the available data) and Abstracts Views on Vision4Press platform.
Data correspond to usage on the plateform after 2015. The current usage metrics is available 48-96 hours after online publication and is updated daily on week days.
Initial download of the metrics may take a while.