Open Access
Fig. 3
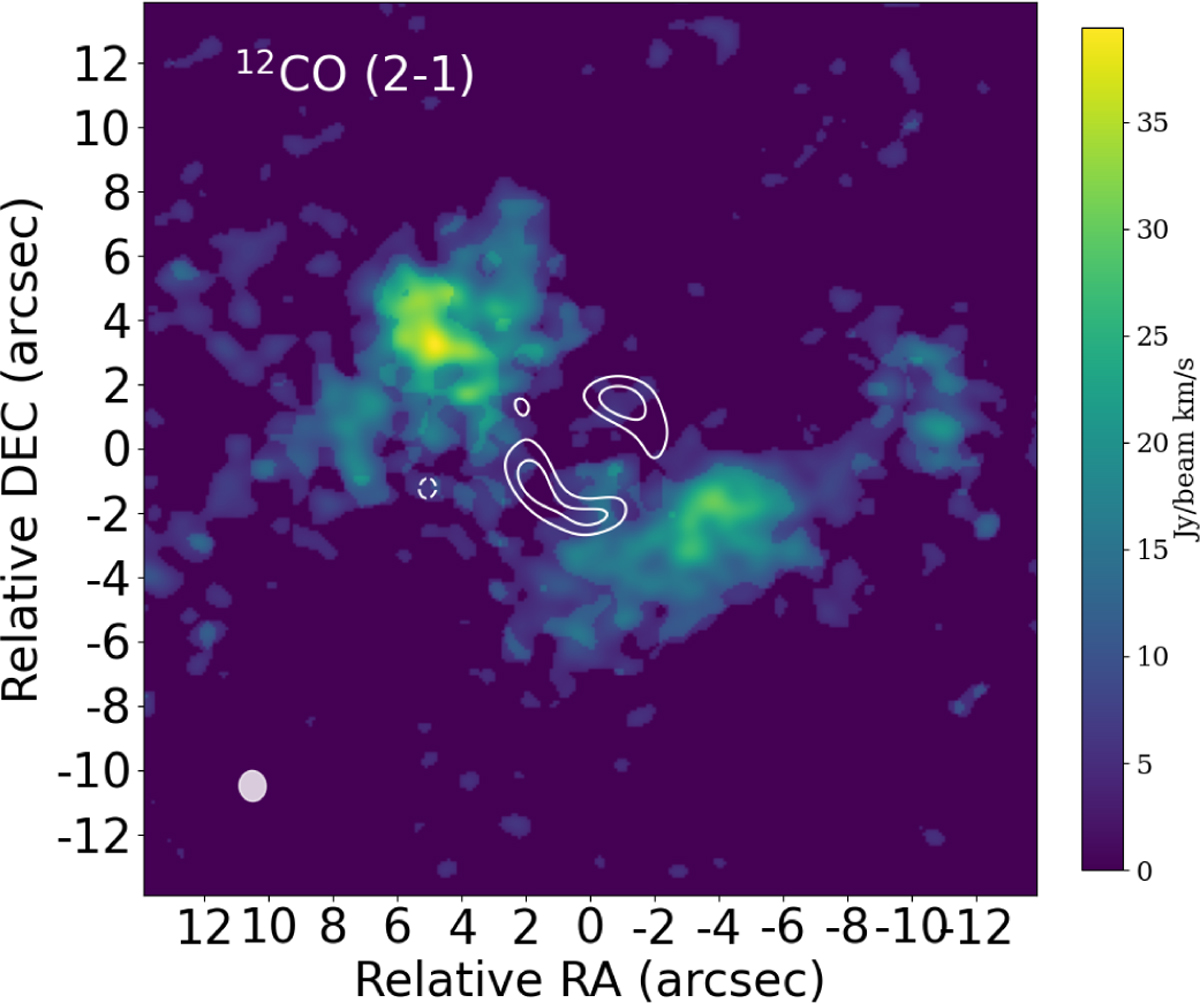
Download original image
Integrated intensity (moment-0) map of the 12CO (2–1) transition observed towards HD 126062. Emission above 3σ in the channels was used to construct this moment map. White contours show the continuum image constructed with a uvtaper. The beam size is indicated in the lower left corner.
Current usage metrics show cumulative count of Article Views (full-text article views including HTML views, PDF and ePub downloads, according to the available data) and Abstracts Views on Vision4Press platform.
Data correspond to usage on the plateform after 2015. The current usage metrics is available 48-96 hours after online publication and is updated daily on week days.
Initial download of the metrics may take a while.