| Issue |
A&A
Volume 703, November 2025
|
|
|---|---|---|
| Article Number | A235 | |
| Number of page(s) | 12 | |
| Section | Planets, planetary systems, and small bodies | |
| DOI | https://doi.org/10.1051/0004-6361/202554463 | |
| Published online | 20 November 2025 | |
Resolving the large exoKuiper belt of the HD 126062 debris disc and extended gas emission in its vicinity
1
Departamento de Física, Universidad de Santiago de Chile, Avenida Victor Jara
3659
Santiago,
Chile
2
Millennium Nucleus on Young Exoplanets and their Moons (YEMS),
Chile
3
Center for Interdisciplinary Research in Astrophysics and Space Exploration (CIRAS), Universidad de Santiago,
Chile
4
Joint ALMA Observatory,
Alonso de Córdova 3107, Vitacura,
Santiago,
Chile
5
European Southern Observatory,
Alonso de Córdova 3107, Vitacura,
Santiago,
Chile
6
Malaghan Institute of Medical Research,
Gate 7, Victoria University, Kelburn Parade,
Wellington,
New Zealand
7
Institute of Astronomy, University of Cambridge,
Madingley Road,
Cambridge
CB3 0HA,
UK
8
European Southern Observatory,
Karl-Schwarzschild-Str. 2,
Garching bei München,
Germany
9
Department of Astronomy and Astrophysics, The Pennsylvania State University, University Park,
PA
16802,
USA
10
Center for Exoplanets and Habitable Worlds, The Pennsylvania State University, University Park,
PA
16802,
USA
11
Astronomy Unit, School of Physics and Astronomy, Queen Mary University of London,
London
E1 4NS,
UK
12
Instituto de Estudios Astrofísicos, Facultad de Ingeniería y Ciencias, Universidad Diego Portales,
Av. Ejército Libertador 441,
Santiago,
Chile
★ Corresponding author: This email address is being protected from spambots. You need JavaScript enabled to view it.
Received:
10
March
2025
Accepted:
15
September
2025
Abstract
Context. Intermediate mass stars (1–3 M⊙) host some of the brightest and most well-studied debris discs. This stellar class is also the most frequent host of molecular gas in systems with ages beyond typical protoplanetary disc lifetimes and the most likely to host detected giant planets in radial velocity surveys. The debris discs of intermediate mass stars have therefore become a fertile ground for studying disc-planet interactions.
Aims. In this work, we present the first ALMA observations towards the A-type star HD 126062, located in Upper Centaurus Lupus/Lower Centaurus Crux, with the aim of characterising the properties of its debris disc.
Methods. We probed the thermal continuum emission using observations at 1.3 mm, which were analysed through image reconstruction while employing different visibility weighting regimes in addition to parametric model fitting to the observed visibilities. The observational setup also covers the frequency of the 12CO molecular line, allowing for imaging of gas in the vicinity of the system.
Results. We detected the dust continuum emission from an exoKuiper belt around HD 126062. Modelled as a Gaussian ring, the visibilities are consistent with a radial separation of R=2.01−0.05+0.04′′, which is equivalent to ≈270−4+5 au, and a full width half maximum of ΔR=0.71″ ± 0.09, or 95 ± 12 au. The continuum emission appears in an almost face-on configuration with an inclination to the line of sight constrained to be ≤17°. 12CO(2–1) emission is detected in the vicinity of the debris disc, with the majority of the emission found external to the exoKuiper belt.
Conclusions. The exoKuiper belt characterised here is one of the largest to be detected, and it is consistent with the previous predictions of the distribution of dust in the system based on spectral energy distribution fitting. The morphology and displacement in velocity with respect to the systemic velocity suggest that the gas is not associated with the star and debris disc, and it most likely originates from a diffuse gas cloud in the nearby galaxy.
Key words: Kuiper belt: general / planets and satellites: general / planet-disk interactions
© The Authors 2025
 Open Access article, published by EDP Sciences, under the terms of the Creative Commons Attribution License (https://creativecommons.org/licenses/by/4.0), which permits unrestricted use, distribution, and reproduction in any medium, provided the original work is properly cited.
This article is published in open access under the Subscribe to Open model. This email address is being protected from spambots. You need JavaScript enabled to view it. to support open access publication.
1 Introduction
Debris discs around A-type stars have been useful testing grounds for exploring the formation and evolution of planetary systems. Some of the first debris discs to have the structure of their thermal emission spatially resolved were A-type stars such as Beta Pictoris, Vega, and Fomalhaut. This was initially achieved at sub-millimetre wavelengths with observations using SCUBA at JCMT (Holland et al. 1998). Subsequent high resolution investigations into each of these systems resolved and characterised their exo-Kuiper belts, which is the major component of the cold dust distribution (MacGregor et al. 2017; Matrà et al. 2019, 2020; Gáspár et al. 2023; Rebollido et al. 2024). Debris discs were traditionally assumed to be gas-poor environments, but now there are over 20 discs (Marino et al. 2020a), including Beta Pic and Fomalhaut (Dent et al. 2014; Matrà et al. 2017), where significant amounts of CO gas have been detected. A large proportion of these gas-rich discs are hosted by A-type stars (Moór 2017). As a result, debris discs around this particular spectral class have become a significant influence on our understanding of the origin of gas in debris discs (e.g. see Cataldi et al. 2023) and its kinematic behaviour as probed by the ALMA Large program ARKS (Marino et al., in prep.).
In addition to being key touchstones for defining the distribution of solid circumstellar material in evolved planetary systems, intermediate mass stars also play a key role in the detection of exoplanets. In radial velocity surveys, the giant planet detection rate peaks at a host mass of ≈2.0 M⊙ (Johnson et al. 2010; Reffert et al. 2015). Intermediate mass stars host some of the best-studied cases of confirmed planetary systems that reside within detectable debris discs. Systems such as these provide an excellent opportunity to directly study planet-disc interactions, particularly given the very low rate of detections of exoplanets embedded within the earlier protoplanetary disc phase. For example, Beta Pic has one confirmed exoplanet, Beta Pic b (Lagrange et al. 2009), and there is evidence of another candidate planet, Beta Pic c, from HARPS RV data (Lagrange et al. 2019). The A-type star HR 8799 hosts a very wide debris disc, reaching ≈ 400 au, in a nearly face-on projection (Booth et al. 2016; Faramaz et al. 2021). Within its inner cavity are four giant planets (Marois et al. 2008, 2010), and as such it has since become an important reference point for studies of giant planets and the debris discs within they are embedded in.
Each step on the pathway from a gas-rich planet-forming protoplanetary disc to a planet-hosting system in which the natal disc has dispersed is not yet fully understood. This transition plays a large role in setting the future exo-planetary architecture (Raymond et al. 2011) and potentially also in determining the atmospheric composition of planets within the system (Kral et al. 2020). Péricaud et al. (2017) identified young gas-bearing debris discs that could be indicative of a ‘hybrid disc’ phase (again, most are A- or F-type stars) where dust appears similar to that in a debris disc (optically thin, as created through a collisional cascade), yet the gas is more similar to that found at the protoplanetary disc stage. In particular, it is rich in H2. The system HD 141569 has a protoplanetary-like gas mass, yet its dust mass is more similar to that of debris discs, potentially indicating an intermediary stage of evolution (Dent et al. 2005; Wyatt et al. 2015; White et al. 2016; Miley et al. 2018). Wyatt et al. (2015) explored the main stages in the transition from protoplanetary disc to debris disc and discussed the key physical processes at work. One of these key processes is the dispersal of molecular gas. Debris discs were traditionally considered to be gas poor, but now gas detections have been made in relatively young debris discs, such as in the samples of Lieman-Sifry et al. (2016) and Moór et al. (2017) that belong to Upper Centaurus Lupus and Lower Centaurus Crux (≈15–20 Myr Luhman 2022), as well as in much older systems (η Corvi, 1–2 Gyr, Marino et al. 2017). Both of these timescales are in tension with those typically expected for the photodissociation of CO in the ISM of 120 yr (Visser et al. 2009) and the typical lifetimes of protoplanetary discs (≈ 10 Myr, Ribas et al. 2014; Wyatt et al. 2015). The quantities of gas detected in these systems would have significant effects on the nature of exoplanets present within the system should it be accreted, as (Kral et al. 2020) investigate in the case of terrestrial planets. As a result, there is great interest in determining the true nature of this gas and understanding how it has survived so long. The release of a secondary generation of gas through collisions between planetesimals in the debris belts may be able to explain the presence of gas at late stages (Marino et al. 2020a), relying on atomic carbon to shield CO from rapid removal via photo-dissociation (e.g. Kral et al. 2019), but current models overpredict the amount of atomic carbon (CI) compared to observations (Cataldi et al. 2023). Models of primordial gas, which has somehow survived from the protoplanetary stage, appear to be more consistent with observed CI quantities (Cataldi et al. 2023), but they still need to explain how the molecular gas has survived for so long.
A-type stars may hold the key to investigating the long-lived gas in debris discs and in determining its origin. Modelling by Nakatani et al. (2021, 2023) finds that depletion of small dust grains can reduce photoelectric heating, which in turn reduces FUV photoevaporation rates in evolved discs around A-type stars, potentially explaining how they retain gas discs at advanced ages and lending support for a ‘primordial’ gas model in which the gas remains from the protoplanetary disc stage. With a secondary gas model in which gas is released from collisions between planetesimals, Marino et al. (2020a) find that A-type stars are the most likely to birth massive planetesimal belts with the capacity to hold a sufficient quantity of frozen-out volatile gas that will later be released through collisions. Both studies outline the importance of initial conditions, in particular the initial gas mass, in setting the mass of material that remains at late stages.
An ideal place to collect data on this transitional phase is in regions with ages just beyond the typical lifetimes of protoplanetary discs, where the majority of discs are expected to have been dispersed or are in the act of being dispersed. A prime example is the region of Lower Centaurus Crux/Upper Centaurus Lupus (LCC/UCL), which is at an age of 15–20 Myr (Pecaut & Mamajek 2016; Luhman 2022). Models of planetesimal collisions suggest the discs at this age should be high in luminosity of thermal dust emission, and if their collisions are enhanced by the stirring action of an inner exoplanet, they may even be approaching their luminosity peak (Wyatt 2008). This provides the perfect environment for studying evolved systems that are planet hosting rather than planet forming, through which we can study disc-planet interactions. Furthermore, they may provide fertile grounds for finding molecular gas in debris discs, as seven out of the 11 gas-bearing debris discs in the sample of Moór et al. (2017) were found in these regions.
In this paper, we present new ALMA observations of the circumstellar environment of the A-type star HD 126062, found in the region of UCC/UCL (Luhman 2022). The first evidence of a disc around the star was found with Spitzer photometry at 24 and 70 μm (Chen et al. 2012, 2014). Here, we show the first characterisation of its debris disc at millimetre wavelengths. We analyse the new data in order to characterise the distribution of dust in the HD 126062 debris disc and assess its potential for future studies of debris disc-exoplanet interactions. In the following section we describe the new observations, and in Section 3 we present the ALMA images and parametrise the dust density distribution through fits to the observed visibilities. In Section 4 we discuss these results and place them in the context of other known systems, and in Section 5 we summarise our main conclusions.
2 Observations
HD 126062 is part of LCC/UCL (Luhman 2022), its ICRS coordinates are 14h24m37.000s −47d10m39.864s and the star is located a distance of ![Mathematical equation: $\[134.1_{-0.6}^{+0.5}\]$](/articles/aa/full_html/2025/11/aa54463-25/aa54463-25-eq3.png) pc (Bailer-Jones et al. 2021) as derived from Gaia DR3 parallaxes (Brown et al. 2021; Gaia Collaboration 2023). ALMA observations were taken using Band 6 receivers on 28th and 29th December 2022, on both occasions employing 46 antennas. During the first observation the average precipitable water vapour (pwv) at zenith was 0.54 mm and the median phase rms was measured at 8.6 ° on the bandpass calibrator, using the 80th percentile projected baseline on a timescale equal to that of the phase referencing timescale. During the second observation pwv was 0.35 mm with a median phase rms was 9.5°. The phase calibrator was J1407-4302 and the flux and bandpass calibrator was J1427-4206. The total integration time spent on the science target HD 126062 was 16 minutes. Two spectral windows, centred at 216.997 and 232.997 GHz, were dedicated to continuum observations, with a total bandwidth of 1.875 GHz and channel widths of 15625 kHz. One spectral window was centred on the 12CO (2−1) molecular transition, with a total of 3840 spectral channels of width 244 kHz, or 0.31 km/s. The final spectral window contained 1920 channels of width 977 kHz, or 1.27 km/s. This window covers both the 13CO (2−1) and C18O (2−1) molecular lines, neither of which were detected. All line-free spectral channels are used to create the continuum images.
pc (Bailer-Jones et al. 2021) as derived from Gaia DR3 parallaxes (Brown et al. 2021; Gaia Collaboration 2023). ALMA observations were taken using Band 6 receivers on 28th and 29th December 2022, on both occasions employing 46 antennas. During the first observation the average precipitable water vapour (pwv) at zenith was 0.54 mm and the median phase rms was measured at 8.6 ° on the bandpass calibrator, using the 80th percentile projected baseline on a timescale equal to that of the phase referencing timescale. During the second observation pwv was 0.35 mm with a median phase rms was 9.5°. The phase calibrator was J1407-4302 and the flux and bandpass calibrator was J1427-4206. The total integration time spent on the science target HD 126062 was 16 minutes. Two spectral windows, centred at 216.997 and 232.997 GHz, were dedicated to continuum observations, with a total bandwidth of 1.875 GHz and channel widths of 15625 kHz. One spectral window was centred on the 12CO (2−1) molecular transition, with a total of 3840 spectral channels of width 244 kHz, or 0.31 km/s. The final spectral window contained 1920 channels of width 977 kHz, or 1.27 km/s. This window covers both the 13CO (2−1) and C18O (2−1) molecular lines, neither of which were detected. All line-free spectral channels are used to create the continuum images.
Continuum images were reconstructed using CASA’s tclean task with a Hogbom minor cycle deconvolution algorithm, (Högbom 1974). Images were created using a range of weighting schemes, in this article the fiducial image is constructed using natural weighting in order to prioritise signal-to-noise ratio over angular resolution. To scrutinise extended structures in the image, we also create images after applying a uvtaper to the visibilities of size ![Mathematical equation: $\[1^{\prime\prime}_\cdot5\]$](/articles/aa/full_html/2025/11/aa54463-25/aa54463-25-eq5.png) . The naturally weighted continuum image achieves a synthesising beam with FWHM
. The naturally weighted continuum image achieves a synthesising beam with FWHM ![Mathematical equation: $\[0^{\prime\prime}_\cdot95 \times 0^{\prime\prime}_\cdot85\]$](/articles/aa/full_html/2025/11/aa54463-25/aa54463-25-eq6.png) and position angle 87°, with an rms noise of 25 μJy/beam. When the uvtaper is applied to the data the resulting synthesised beam has size
and position angle 87°, with an rms noise of 25 μJy/beam. When the uvtaper is applied to the data the resulting synthesised beam has size ![Mathematical equation: $\[1^{\prime\prime}_\cdot85 \times 1^{\prime\prime}_\cdot65\]$](/articles/aa/full_html/2025/11/aa54463-25/aa54463-25-eq7.png) , 90° and the rms is measured at 40 μJy/beam. Images of the 12CO (2–1) transition are created by re-gridding the data along the spectral axis into channels of width 0.62 km/s using a rest frequency of 230.5238 GHz, before applying tclean with natural weighting. We apply masks to the channels using the AUTO-MULTITHRESH algorithm implemented in CASA’s tclean task (Kepley et al. 2020). This achieves a synthesising beam of
, 90° and the rms is measured at 40 μJy/beam. Images of the 12CO (2–1) transition are created by re-gridding the data along the spectral axis into channels of width 0.62 km/s using a rest frequency of 230.5238 GHz, before applying tclean with natural weighting. We apply masks to the channels using the AUTO-MULTITHRESH algorithm implemented in CASA’s tclean task (Kepley et al. 2020). This achieves a synthesising beam of ![Mathematical equation: $\[0^{\prime\prime}_\cdot95 \times 0^{\prime\prime}_\cdot83\]$](/articles/aa/full_html/2025/11/aa54463-25/aa54463-25-eq8.png) , −84.7°, producing an image cube with an rms noise level measured at 2 mJy/beam within each channel. The moment 0 map of the 12CO emission is created by summing all pixels that contain emission above the 3σ level in individual channels.
, −84.7°, producing an image cube with an rms noise level measured at 2 mJy/beam within each channel. The moment 0 map of the 12CO emission is created by summing all pixels that contain emission above the 3σ level in individual channels.
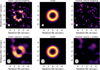 |
Fig. 1 Top row: fiducial image of the continuum observations of HD 126062 reconstructed using tclean with natural weighting (left). Gaussian ring model derived from the MCMC fit to the visibilities (middle). Residual image following the subtraction of the model from the data, restored using the same imaging parameters as the tclean image (right). Bottom row: same as the top row, except tclean images have been reconstructed with a uvtaper of |
![Mathematical equation: $\[1^{\prime\prime}_\cdot5\]$](/articles/aa/full_html/2025/11/aa54463-25/aa54463-25-eq4.png)
3 Results
3.1 An exoKuiper belt detected at 1.3 mm
Through continuum imaging we detect an extended belt of mm emission around the star for the first time. Many images of the dataset were created by varying the visibility weighting in order to scrutinise the faint emission. Figure 1 shows two representative examples from the imaging experiments. The top-left panel was created with natural weighting, whilst the bottom-left panel shows the image created with the additional uvtaper applied. In the natural weighted image the observed peak brightness is 114 μJy/beam resulting in a peak signal-to-noise ratio of 4.6. The emission takes the form of several emission peaks at ≈4σ that are distributed in a ring-like morphology that is more apparent in the tapered image. There are breaks in the ring-like brightness distribution at ~58° and 238° measured East of North. The peak brightness of the tapered image is measured at 187 μJy/beam.
To accurately quantify the basic geometric properties of the newly discovered ring of mm emission around HD 126062, we fit the visibilities with a parametric model using the GALARIO package (Tazzari et al. 2016) and uvplot (Tazzari 2017). Similarly to Marino et al. (2016), we assume that the mm dust distribution of the debris disc can be modelled as a Gaussian ring defined by
![Mathematical equation: $\[F_\nu=f_0 ~\exp~ \left[-\frac{1}{2}\left(\frac{\mathrm{R}_0-\mathrm{R}}{\sigma}\right)^2\right], \sigma=\frac{\Delta \mathrm{R}}{2 \sqrt{2\mathrm{\ln} 2}},\]$](/articles/aa/full_html/2025/11/aa54463-25/aa54463-25-eq9.png) (1)
(1)
where f0 is a flux normalisation factor, R is the distance from the star, R0 the centre of the ring and the width is parametrised by the standard deviation of the Gaussian, σ, which can be related to the full width at half maximum, ΔR. We also sample the inclination (‘inc’) and position angle (‘PA’). Using Markov chain Monte Carlo (MCMC) sampling through the emcee package (Foreman-Mackey et al. 2013) to sample the posterior probability distribution in order to achieve a representative model given the observed deprojected visibilities. For the results presented here, 50 walkers were used taking 18 000 steps with a 1000 step burn-in phase. The effective sample size and autocorrelation time were calculated in order to ensure these chosen parameters were appropriate, and convergence was assessed by calculating the rank normalised R-hat diagnostic (Gelman & Rubin 1992). Table 1 gives the adopted prior distributions for each of the properties of interest.
We took a representative model from the MCMC by taking the median value from probability distribution. Diagnostic plots are shown in Appendix A in Figure A.1, which demonstrate that the model follows the binned visibilities well until they become dominated by noise at baselines larger than ≈200kλ. The corner plot of distributions of each of the parameters is also shown in the bottom panel of Figure A.1. Precise results are found for the flux, the radial position and the width of the ring. Considering the distance to HD 126062 from Earth, the centre of the mm-ring is found to be at a physical separation from the star of ≈![Mathematical equation: $\[270_{-4}^{+5}\]$](/articles/aa/full_html/2025/11/aa54463-25/aa54463-25-eq10.png) au. We can convert the standard deviation of the Gaussian ring into a physical width, which corresponds to a full width half maximum as shown by the expression for σ in Equation (1), giving ΔR= 95±12 au. The uncertainties on the physical radial separation and width of the ring are calculated by taking the 16th and 84th quartiles of the posterior distribution and converting these to a spatial scale considering the distance from Earth to HD 126062. The MCMC results place an upper limit (where the limit is set by the 84th percentile) on the inclination of the exoKuiper belt of 17°, with the lowest values preferred by the posterior distribution. We can therefore conclude that the data at hand are consistent with an almost face-on orientation. A face-on orientation naturally makes it difficult to constrain a position angle for the source, which can explain why this value remains unconstrained by the results in Figure A.1. Observations with higher angular resolution could place a more concise constraint on this value, which also depends upon the vertical height of the emitting material (Marino et al. 2016), and would also reveal the sharpness of the inner edge of the debris disc, which itself can give indications about exoplanets present within the system (Marino et al. 2020b). Despite the areas of decreased brightness in the ring, which are clearest in the tapered image, the residual maps in Figure 1 demonstrate that the data is consistent with a symmetric brightness distribution. The HD 126062 exoKuiper belt has a large radius as should be expected if we assume a correlation between belt distance and stellar luminosity (e.g. as in Matrà et al. 2019), given that the central star is quite luminous (15.5 L⊙). The belt of HD 126062 is, however, relatively thin. Its fractional width ΔR/R = 0.35 ± 0.06, whereas 70% of REASONS survey discs are found to be wide ΔR/R > 0.5 (Matrà et al. 2025). The dust distribution around HD 126062 is discussed in more detail in Section 4.1.
au. We can convert the standard deviation of the Gaussian ring into a physical width, which corresponds to a full width half maximum as shown by the expression for σ in Equation (1), giving ΔR= 95±12 au. The uncertainties on the physical radial separation and width of the ring are calculated by taking the 16th and 84th quartiles of the posterior distribution and converting these to a spatial scale considering the distance from Earth to HD 126062. The MCMC results place an upper limit (where the limit is set by the 84th percentile) on the inclination of the exoKuiper belt of 17°, with the lowest values preferred by the posterior distribution. We can therefore conclude that the data at hand are consistent with an almost face-on orientation. A face-on orientation naturally makes it difficult to constrain a position angle for the source, which can explain why this value remains unconstrained by the results in Figure A.1. Observations with higher angular resolution could place a more concise constraint on this value, which also depends upon the vertical height of the emitting material (Marino et al. 2016), and would also reveal the sharpness of the inner edge of the debris disc, which itself can give indications about exoplanets present within the system (Marino et al. 2020b). Despite the areas of decreased brightness in the ring, which are clearest in the tapered image, the residual maps in Figure 1 demonstrate that the data is consistent with a symmetric brightness distribution. The HD 126062 exoKuiper belt has a large radius as should be expected if we assume a correlation between belt distance and stellar luminosity (e.g. as in Matrà et al. 2019), given that the central star is quite luminous (15.5 L⊙). The belt of HD 126062 is, however, relatively thin. Its fractional width ΔR/R = 0.35 ± 0.06, whereas 70% of REASONS survey discs are found to be wide ΔR/R > 0.5 (Matrà et al. 2025). The dust distribution around HD 126062 is discussed in more detail in Section 4.1.
To estimate the flux density from the exoKuiper belt, we measured a flux density from within a radius of R + ΔR as constrained by the results from the MCMC in uv-space as described above. In the natural-weighted image this results in a flux density measurement of 0.94±0.09 mJy/beam, where the uncertainty is calculated by propagating a 10% uncertainty in ALMA flux calibration (Cortes et al. 2025) and the statistical uncertainty in the measurement over this region.
Parameter space explored by the MCMC.
3.2 Spectral energy distribution of HD 126062
The only prior knowledge of a debris disc around HD 126062 comes from spectral energy distribution (SED) fitting. Debris discs are often well described by a combination of two blackbodies at different temperatures (Kennedy & Wyatt 2014), which can be interpreted as contributions from belts of material in the disc as distinct temperatures. Fitting the observed SED of debris discs can therefore give some indication of the distribution of dust density in the disc, (as applied to HD 126062 in Chen et al. 2014; Launhardt et al. 2020; Pearce et al. 2022). The properties of the exoKuiper belt predicted by previous SED fitting attempts are very similar to those we independently constrain here through the resolved mm detection. For example the inferred location of the outer belt in HD 126062 by Pearce et al. (2022) of 300±80 au matches very well to that which we constraint here through fits to observed visibilities in Section 3.1 of ![Mathematical equation: $\[\mathrm{R}\mathrm{=}270_{-4}^{+5}\]$](/articles/aa/full_html/2025/11/aa54463-25/aa54463-25-eq11.png) au and ΔR= 95 ± 12 au.
au and ΔR= 95 ± 12 au.
Data taken at longer (i.e. ≈mm) wavelengths provide important constraints that aid these efforts, as they trace the larger grain sizes. Here we update the SED fit to HD 126062 by including the new photometric point at 1.3 mm of 0.94±0.16 mJy in order to place tighter constraints on location of grains emitting within the inner regions of the disc. We followed the procedure as outlined in Yelverton et al. (2019) and obtained the results shown in Figure 2. Two components are required to achieve a good fit: one characterised by a blackbody of temperature Twarm=168±8 K, and the other at Tcool= 47±2 K. These temperatures can be interpreted in terms of distance from the central star by calculating the blackbody radius using
![Mathematical equation: $\[R_{\mathrm{BB}}=1 ~\mathrm{au}\left(\frac{T_{\mathrm{BB}}}{278 \mathrm{~K}}\right)^{-2}\left(\frac{L_*}{L_{\odot}}\right)^{1 / 2}.\]$](/articles/aa/full_html/2025/11/aa54463-25/aa54463-25-eq12.png) (2)
(2)
The blackbody radius derived from the fit to the SED alone does not reflect an accurate disc location. To find this we required the application of some correction factor that takes into account dust grain emission properties (Booth et al. 2013; Pawellek & Krivov 2015; Yang et al. 2024). Here we used a correction factor, Γ, to convert the derived blackbody radius into a more accurate disc location, which takes the form
![Mathematical equation: $\[R_{\mathrm{SED}} \equiv \Gamma R_{B B}, \quad \Gamma=A\left(\frac{L_*}{L_{\odot}}\right)^B.\]$](/articles/aa/full_html/2025/11/aa54463-25/aa54463-25-eq13.png) (3)
(3)
In calculating the conversion factor, we adopted the approach of studies that analyse belts resolved at millimetre wavelengths by ALMA (as opposed to similar Herschel studies), taking A=2.92±0.50, B=−0.13±0.07 (Pawellek et al. 2021; Pearce et al. 2022). This results in a Γ = 2.0 ± 0.5. The cool blackbody contribution from the SED fit therefore predicts a belt location at 286±79 au, where the error is propagated from uncertainties on the temperature of the blackbody and of the conversion factor Γ. This is consistent with the location constrained from the model fit to observed visibilities in the previous section of ![Mathematical equation: $\[\mathrm{R}\mathrm{=}270_{-4}^{+5}\]$](/articles/aa/full_html/2025/11/aa54463-25/aa54463-25-eq14.png) au.
au.
Debris discs with a single, wide belt can have similar SEDs to those with two spatially separated belts (Kennedy & Wyatt 2014). In this case, the exo-Kuiper belt in HD 126062 appears to be relatively narrow (Section 3.1, ΔR/R = 0.35 ± 0.06), and so we can have more confidence in interpreting the SED fit as evidence of two dust components rather than one, wider belt. The warm blackbody contribution to the SED fit therefore predicts the location of an inner, warmer component to be at 22±6 au. With this fit we also constrain properties of the central star, for which a best fit is found with T* = 8940 ± 60 K, L* = 15.5 ± 0.2 L⊙, R* = 1.6 ± 0.1 R⊙. We achieve tighter constraints on the position of the continuum emission in the outer disc in comparison to that presented by Pearce et al. (2022) where they find a belt location of 300±80 au. This is because here we use the newly constrained values for the stellar luminosity L*, and the effective temperature, Teff of the cool outer belt, derived from SED fitting including the new mm photometric point.
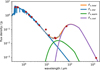 |
Fig. 2 Fit to the SED of HD 126062 comprised of two blackbody components and a stellar contribution. Error bars are included but are smaller than the data point markers. |
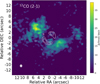 |
Fig. 3 Integrated intensity (moment-0) map of the 12CO (2–1) transition observed towards HD 126062. Emission above 3σ in the channels was used to construct this moment map. White contours show the continuum image constructed with a uvtaper. The beam size is indicated in the lower left corner. |
3.3 12CO (2–1) emission in the vicinity of HD 126062
The observing setup of the ALMA observations covered the (2–1) transition of the 12CO molecule. In Figure 3, we present the moment 0 map of the emission detected towards HD 126062. The moment 0 map was created by integrating emission from channels with emission greater than 3σ, each of which is also individually plotted in Appendix B. Although 13CO(2–1) and C18O(2–1) lines are covered by the spectral setup, they are not detected in these observations.
The gas in Figure 3 shows an unusual morphology, with two lobes of emission appearing on either side of the dust disc along a NE–SW axis. Very little emission is detected from regions that are radially interior to the exoKuiper belt that is detected by the continuum observations. The rms is measured from a moment 0 image constructed without a noise clip, which gives a value of 4.1 mJy/beam km/s, the peak emission in the image reaches 9.6σ. In Figure 4, we show the spectrum of the 12CO line extracted from the detected emission. We also extract emission from specific regions in order to make a comparison. These additional regions are that which contains the exoKuiper belt detected in the continuum data, and also only the regions external to the disc, up to a radius of 12″, which encompasses the vast majority of the 3σ emission in the moment 0 map (although some diffuse emission exists beyond this point, e.g. at relative RA=−12″, relative Dec=0″ in Figure 3). Also plotted in the bottom panel of Figure 4 is the peak intensity along the line of sight for each pixel within the cube with a large field of view to show the surrounding environment. The 12CO is extended over large angular scales, 3σ emission spans over 24″ in the field of view. The broad distribution of the emission appears roughly centred towards the position of the star, which invites speculation that the 12CO(2–1) emission we detect is associated with the system. The environment of HD 126062 in LCC/UCL has an estimated age of 15–20 Myr, meaning one would generally expect for any cloud or envelope material is to have already been dispersed.
The gas line is displaced from the rest frequency of 12CO by ≈1–2 km/s, and from the Gaia DR3 velocity for HD 126062 of 7.2 km/s (Figure 4). The detected emission spans just three channels of size 0.62 km/s. A narrow line is expected for a rotating, nearly face-on disc, but the observed spatial distribution of the 12CO emission does not match this interpretation (see Figure 3). A small amount of emission is detected within the disc region, i.e. that within the outer edge of the dust emission R+ΔR, but its spectrum is very similar to that of the wider gas emission (as shown in Figure 4) and therefore appears to be of a similar origin. The origin of the detected 12CO is discussed further in Section 4.3.
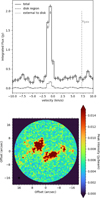 |
Fig. 4 Top: 12CO spectra extracted from different regions of the image. The disc region is found within R+ΔR; the external region begins at R+ΔR and extends as far as 3σ emission is detected in the moment 0 map (≈12″). The total encompasses both of these regions. The systemic velocity as measured by Gaia is indicated by a vertical line. Bottom: moment 8 map of 12CO emission, which collapses the cube in the spectral axis and shows the peak emission for each pixel in the cube. |
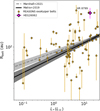 |
Fig. 5 exoKuiper belt positions as characterised by the REASONS survey, plotted as a function of the stellar luminosity of their host, where error bars indicate ΔR as derived by the given references. HD 126062 is also plotted, using the stellar luminosity as derived from the SED fitting in this work. We also plot distance-stellar luminosity relations, R ∝ Lα fit to samples of discs observed in the millimetere (Matrà et al. 2019) and far-IR (Marshall et al. 2021). |
4 Discussion
4.1 Constraining the distribution of dust in HD 126062
4.1.1 Millimetre radial brightness variation
The exoKuiper belt of HD 126062 presented here with a radius of ~270 au is one of the largest that has been detected to date. In Figure 5 we plot the belt location in HD 126062 amongst the other known and spatially resolved exoKuiper belts from the REASONS survey (Matrà et al. 2025). The most extended, angularly resolved exoKuiper belt is that of HR 8799 (Booth et al. 2016; Faramaz et al. 2021), a system known for having four confirmed giant planets orbiting interior to the belt at R=290 ± 10 au. Other extended belts with a radius comparable to that of HD 126062 within its uncertainties also have a similar stellar luminosity. The most similar sources, which occupy the upper right of Figure 5 are HD 84870 with Rbelt = 260±50 au, HD 15257 has Rbelt = ![Mathematical equation: $\[270_{-40}^{+60}\]$](/articles/aa/full_html/2025/11/aa54463-25/aa54463-25-eq15.png) au and HD 158352 has Rbelt = 270±20 au, where the belt radii are taken from Matrà et al. (2025). All of these systems with very wide belts are A- or F-type stars and reside in the top right corner of Figure 5. Thus far only HR 8799 has been confirmed to host exoplanets. The size of this new exoKuiper belt contributes to maintain the previously identified trend of the brightest host stars possessing the exoKuiper belts with the largest radii. Both Matrà et al. (2019), using data from ALMA at mm wavelengths, and Marshall et al. (2021) with far-IR data from Herschel, have fitted relations of the form
au and HD 158352 has Rbelt = 270±20 au, where the belt radii are taken from Matrà et al. (2025). All of these systems with very wide belts are A- or F-type stars and reside in the top right corner of Figure 5. Thus far only HR 8799 has been confirmed to host exoplanets. The size of this new exoKuiper belt contributes to maintain the previously identified trend of the brightest host stars possessing the exoKuiper belts with the largest radii. Both Matrà et al. (2019), using data from ALMA at mm wavelengths, and Marshall et al. (2021) with far-IR data from Herschel, have fitted relations of the form ![Mathematical equation: $\[R_{\text {belt }} \propto L_{*}^{\alpha}\]$](/articles/aa/full_html/2025/11/aa54463-25/aa54463-25-eq16.png) . Although a large spread is identified in both studies, a trend of larger belts around more luminous stars does emerge. The REASONS sample of 74 planetesimal belts agrees with these previous results in identifying a general trend, although they find a shallower slope and a much larger spread in belt size for a given stellar luminosity. Selection bias towards more luminous targets may play a role here. Choosing only the most luminous discs will result in a shallower slope, and could explain the absence of very large belts around stars with lower luminosity (Marshall et al. 2021; Matrà et al. 2025). Nevertheless, there still remains a lack of small belts of ≈10 s of au in observations, which may indicate they are dispersed more quickly by collisional evolution (Matrà et al. 2025) in comparison to larger belts such as that around HD 126062.
. Although a large spread is identified in both studies, a trend of larger belts around more luminous stars does emerge. The REASONS sample of 74 planetesimal belts agrees with these previous results in identifying a general trend, although they find a shallower slope and a much larger spread in belt size for a given stellar luminosity. Selection bias towards more luminous targets may play a role here. Choosing only the most luminous discs will result in a shallower slope, and could explain the absence of very large belts around stars with lower luminosity (Marshall et al. 2021; Matrà et al. 2025). Nevertheless, there still remains a lack of small belts of ≈10 s of au in observations, which may indicate they are dispersed more quickly by collisional evolution (Matrà et al. 2025) in comparison to larger belts such as that around HD 126062.
4.1.2 Axisymmetric brightness in the exoKuiper belt
As demonstrated by the visibility fits to the continuuum observations described in Section 4.1, the exoKuiper belt is consistent with an azimuthally symmetric ring. However in the images displayed in Figure 1, the azimuthal brightness of the ring is not continuous. Two breaks in emission are particularly clear in the tapered image, with fainter parts of the rings found at 58° and 238°. The detection of the ring material is in the 3–4σ range, so either noise or slightly fainter regions of the disc may explain the azimuthal variations. There are published cases of azimuthal brightness variations in debris discs; usually such features have been detected in scattered light observations or molecular gas observations, but they are less pronounced or undetected in observations of thermal emission at millimeter wavelengths (e.g. AU Mic, β Pic MacGregor et al. 2013; Matrà et al. 2019), and so it may be that shorter wavelength observations reveal substructure asymmetry in HD 126062. Debris disc asymmetries can occur due to apocentric or pericentric ‘glow’, where the exact nature of these features depends on the eccentricity of the disc (Lynch & Lovell 2022), as well as the width of the belt, the angular resolution of the observations (Lovell & Lynch 2023) or the observing wavelength as demonstrated, for example, by the difference between Herschel and ALMA images of the Fomalhaut debris disc (Acke et al. 2012; MacGregor et al. 2017). There are also comparisons that can be made with younger systems. The 180° separation between the two fainter parts of the ring is reminiscent of similar structures observed in observations of protoplanetary discs by ALMA (e.g. J1604-2130, DoAr44, Mayama et al. 2018; Arce-Tord et al. 2023) and in scattered light observations by SPHERE (Bohn et al. 2022). Symmetric intensity diminutions such as these are often interpreted to result from shadows cast by a misaligned inner component of the circumstellar disc that intercepts light. In Section 3.2, it is indeed established that a hot inner component is required to fit the SED, with a predicted location at 22±6 au. However, this predicted warm component is not sufficiently massive to provide the optical depth necessary to create such a large shadow. In order to be optically thick, the inner disc would have to be massive enough that thermal emission from the dust would be detectable with our observations. Furthermore, the continuum data is well fit by a symmetric model, as evidenced by the residual maps in Figure 1. We cannot entirely rule out low-level underlying asymmetries in the brightness distribution that could be investigated with deeper observations, which if found could provide useful information for constraining the eccentricity of the ring or could signal interactions with an unseen planet.
We currently lack further resolved imaging that can help characterise the system. SPHERE observations of HD 126062 were made as part of the observing program presented in Matthews et al. (2018) but no detection of a debris disc was made. This is perhaps not surprising in light of the disc properties we derive here. Total intensity observations are most successful at detecting edge-on discs where the signal-to-noise ratio in individual pixels reaches a maximum. Furthermore, angular differential imaging techniques will remove signal from a symmetric (or face-on) emission structure, and there is yet to be a debris disc detected with this method that has an inclination along the line of sight of the observer that is lower than 65° (Matthews et al. 2023). Three faint, wide-separation candidates are identified in the SPHERE images, but appear to be background objects (Matthews et al. 2018). Future observations using differential polarimetric imaging might offer a more promising route for detection of the disc in scattered light. These observations might detect pericentre or apocentre glow as seen in other systems. New observations could also clarify whether the intensity diminutions are due to shadowing from an inner disc component, as shadows would also appear in scattered light images, or whether the emission originates from a mostly symmetric ring of dust, the model which is consistent with current 1.3 mm ALMA observations as we demonstrate in this work.
4.2 Constraints on planets in the system
An unseen planet can clear gaps in the debris disc by scattering nearby particles throughout its orbit, and so for any well-defined debris disc density configuration we can infer what type of planets would have been able to create the observed distribution through gravitational interaction and migration. If the debris disc is relatively massive with respect to the planet, then the inter-change of energy as a result of the disc-planet interactions will result in an inwards migration motion for the planet (Ida et al. 2000; Pearce & Wyatt 2014). Alternatively, if the planet is relatively massive compared to the debris disc, then the dusty disc material will disperse quickly and will affect the planet’s orbital semi-major axis to a minimal extent. Friebe et al. (2022) explore the carving of debris disc gaps by planets in the context of these mass constraints and apply their results to a number of debris disc systems. They find that two solutions are found in each case: one of a high-mass planet that barely migrates and another of a lower mass planet that migrates inwards to a greater extent, clearing a gap in the debris disc as it does so. We adopt this approach of Friebe et al. (2022) to apply constraints on the mass of an unseen planet residing in the HD 126062 system, assuming a single planet is responsible for the observed dust distribution.
For these calculations we describe the outer disc using the newly constrained exoKuiper belt parameters from Section 3.1, in addition to constraints on the inner, warm component of the debris disc that are derived from the SED fitting in Section 3.2. Specifically, the target gap width is defined as the distance between the inner bound to the cold Kuiper belt and the outer limit placed on the inner disc emission by SED fitting. We calculate an uncertainty on this width by propagating the uncertainty on the width and position of the outer cool belt, and the uncertainty on the position of the inner disc. We therefore consider a target gap width of 195±58 au. The planetary orbits are assumed to be circular and in the same plane as the disc. We consider an indicative range of initial debris disc masses at the point where the planet’s influence begins to dominate the dust distribution in order to demonstrate the range of potential outcomes. Here we are informed by Krivov & Wyatt (2021), who suggest 10 M⊕ as an approximate minimum mass for debris discs in order to successfully sustain a collisional cascade. The maximum dust mass of a debris disc is more difficult to constrain, and depends on a number of factors that are not yet well constrained, including the uncertain calculation of dust masses in protoplanetary discs, the rate of material replenishment in circumstellar discs and the fraction of total disc mass that is contained within solids. Krivov & Wyatt (2021) conclude that masses greater than ≈100–1000 M⊕ are less likely. Figure 6 shows the results of these calculations, which give the size of the gap that is carved by a range of planet masses1. The specific predicted planet masses that satisfy the dust distribution are summarised in Table 2, in which two planetary masses are given, reflecting the degeneracy highlighted by Friebe et al. (2022).
In addition to the results of Table 2, we also consider constraints placed by previous work on the system. There are upper limits from non-detections in SPHERE observations. Matthews et al. (2018) converted their contrast limits into upper limits on planet mass using COND (Baraffe et al. 2003) and DUSTY (Chabrier et al. 2000) evolutionary models, resulting in limits for direct imaging of ≈ 1 MJup at 10 au, or 2 MJup at 200 au. There are also limits from previous attempts to constrain putative planet masses through dynamices. For example HD 126062 is included in the work of Pearce et al. (2022), where data from the planet-hunting ISPY, LEECH and LIStEN surveys are used in conjunction with descriptions of disc dust distribution from SED fitting which is similar to that performed in this work, except without our new, updated values for the radius and width of the outer belt. Pearce et al. (2022) estimate the minimum mass required of a single planet to carve the disc yet evade detection to be 7 MJup, and also consider a multi-planet scenario, in which case they posit that each planet should be at least 3 MJup. Both of these constraints are above the limits derived from the SPHERE non-detections. Our calculations using the distribution of mm brightness as constrained in this work suggest that planets responsible for sculpting the disc could be much less massive than this. For a massive initial disc the responsible planet could have a mass approaching that of Jupiter (e.g. top row Table 2), whereas in the case for lower initial disc masses the predicted planet mass is more similar to Neptune- or Earth-mass planets. This demonstrates the importance of a well-characterised outer disc when using our adopted method for inferring potential planet mass, which can be achieved through observations at millimetre and sub-millimetre wavelengths. Future observations with higher angular resolution will be able to constrain the distribution of material in the outer disc with even greater precision, which in turn would place tighter constraints on the mass of potential planets responsible for carving the observed dust distribution. Future observations would also improve the characterisation of the inner regions. Currently the uncertainty on the gap width is dominated by the error on the location of the inner disc, because it is relatively poorly constrained due to a lack of a spatially resolved detection. This could be addressed in the future via deep observations of the inner regions of the system, which might require higher frequency ALMA observations, or alternatively, mid-IR observations with JWST/MIRI.
The sensitivity limits of direct imaging (Matthews et al. 2018) are consistent with the lower planet mass and stronger migration scenarios presented in Table 2, all of which are below the detection limits and constraints set by previous work. The high mass, weaker migration scenario leads to very high planet masses, and can be ruled out when we consider the evidence from previous observations searching for exoplanets in the system. Therefore if a single, embedded exoplanet within the debris disc is responsible for carving a gap in the dust disc that we observe, the planet is likely to have had a relatively low mass (the first results column in Table 2) and migrated inwards to a relatively large extent. For example, in the case of an initial disc mass of 100 M⊕, the planet would have to begin migrating and end at 212 au, and stop at around 33 au in order to explain the gap we observe using just a single planet. Our calculations here consider a single planet in order to place mass constraints. It may be that multiple lower mass planets exist in the HD 126062 system, and act in concert to carve the wider gap that has been observed. Future high sensitivity direct imaging campaigns would be required to confirm that planets reside in this system.
In protoplanetary discs there is a correlation between measured disc masses and the spectral type of the host star (Andrews et al. 2018; Pascucci et al. 2016), intermediate mass T Tauris and Herbigs stars host more massive dust (Stapper et al. 2022) and indeed gas (Stapper et al. 2024) discs than their lower mass counterparts. Greater masses in the protoplanetary phase provide a greater reservoir of solid particles which can eventually form part of the debris disc, as may have occurred around the A-type star HD 126062, leading to the large exoKuiper belt that has been detected in the new ALMA observations. A high disc mass enables migration over larger distances, particularly if the planets are low in mass, as the results here favour for any putative planets around HD 126062.
Given that the system is relatively young (for a debris disc), any putative planet will likely be bright and thus a prime target for direct imaging. The constraints set in this work will aid with the design of future planet searches in HD 126062. Deeper planet searches in HD 126062 may yet provide a new arena in which the formation of giant planets can be investigated. This is particularly exciting given the detection of four wide orbit, giant planets around the very similar star of HR 8799, where ALMA observations also detected a large exoKuiper belt at a similar radius to that of HD 126062 (as shown in Figure 5).
By interpreting large exoKuiper belts as the result of interactions between the disc and planets on wide orbits, we enable the study of a population of planets that are the least likely to be detected by the most successful modes of planet detection such as the radial velocity and transit methods. In this way debris discs are a key resource in studying the formation of planets with relatively long orbits. In the case of HD 126062, if the distribution of solids in the large debris disc has resulted from the shepherding and stirring of a single planet, our results suggest that planet must have formed in the outer regions of the young disc, and migrated inward. This might initially suggest that the putative planet is unlikely to have formed via the widely favoured core-accretion model of planet formation, under which the timescales for the accumulation of disc material in the outer regions are simply too long. However, formation via the gravitational instability method is predicted to produce giant planets (Kratter et al. 2010; Forgan & Rice 2011), whereas the constraints set here prefer sub-Jupiter masses. Even in the case of planetary system HR 8799, in which all the detected planets are super-Jovian in mass, Kratter et al. (2010) point out that a number of stringent criteria must be met for GI to remain the favoured formation pathway. To disentangle these competing scenarios, further observational constraints are essential. In particular, deeper imaging campaigns targeting wide-orbit planets, together with systematic surveys of debris discs around A-type stars, will be crucial for testing whether gravitational instability or core accretion is the dominant mechanism shaping these planetary systems.
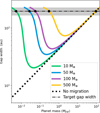 |
Fig. 6 Gap widths opened by different masses of orbiting exoplanets calculated for four different values of the initial debris disc mass. The horizontal line shows the target gap width, which has been measured from the dust distribution as defined by this work. The dotted line shows the result for a case in which there is no migration from the planet and the shaded area indicates the calculated uncertainty on the target gap width in the system. |
Specific masses calculated for planets capable of carving the HD 126062 dust distribution through their orbital motion when assuming a circular orbit and a range of potential initial disc masses.
4.3 12CO (2–1) emission in the vicinity of HD 126062
4.3.1 A lack of evidence connecting gas emission to HD 126062
Here, we consider potential interpretations of the 12CO(2–1) emission that is detected and assess to what extent they are consistent with the data at hand on HD 126062. The observed properties of the emission are not consistent with the typical scenarios invoked to explain gas in debris discs, and we explore this fact in the following.
The regions of peak brightness in the 12CO(2–1) emission are detected at greater separation from the star than the exoKuiper belt, and are broadly aligned with the two faintest parts of the continuum ring. This naturally invites speculation of a physical connection between the two, but as was discussed in Section 3.1, results from visibility fitting of the continuum data strongly favour an inclination closer to face-on (<17°). With the current data, we therefore favour scenarios in which, in terms of projection on the sky, the gas is mainly external to a face-on debris disc, rather than one in which the emitting gas is co-spatial with a disc that is more extended than the continuum belt.
Very little emission is detected from regions that are interior to the exo-Kuiper belt, whereas significant 12CO(2–1) intensity is mostly detected externally to the disc. Models of gas in debris discs do not predict gas that is found only in locations radially external to the dust distribution, as is the case in the images in Figures 3 and 4. In some systems the gas emission is observed to extend further inwards than the detectable levels of mm dust emission (e.g. HD 21997, 49 Ceti, Kospal et al. 2013; Moór et al. 2013; Hughes et al. 2017), but here we find the reverse situation. If the gas in the debris disc is secondary, one would generally expect the gas and dust to be largely co-spatial, as it is from collisions of planetesimals within the dust belts that gas is released. Although some viscous spreading does occur from this birth-site within the belt (Marino et al. 2020a). In a primordial gas scenario, the configuration of gas and dust could be more similar to that seen in protoplanetary discs, where the gas disc is much more extended than the dust disc (e.g. Trapman et al. 2019). However, in protoplanetary discs the gas density profile is usually centrally peaked, whereas in Figure 3 there is a lack of emission from within the inner regions. The lack of emission from within the ring of HD 126062 is puzzling, as we would ordinarily expect the regions closest to the star to be the hottest, and more likely to be emitting line emission, rather than those at greater radial separation, and so such a scenario seems difficult to achieve. It could be that the CO actually originates from an object in the background to HD 126062 and that emission is being blocked along the line of sight of the observer in order to result in an apparent inner cavity of gas emission. This might occur if the disc contained large quantities of CO that absorbs the CO radiation from the background, but is so cold that it does not emit strongly itself.
Perhaps then, the gas we detect has recently exited the HD 126062 system. It is unlikely in this case that photoevaporative dispersal is at play. Given the spectral type of the star and the distance to the exoKuiper belt, the gas could not be heated to a temperature that would unbind it gravitationally from the host star. At the position of the exoKuiper belt, R=270 au, this would require a temperature ~3139 K. Furthermore, we would expect a much greater velocity displacement from that of the system in the case of a wind. Alternatively, gas may leave the system via a wind. Kral et al. (2023) model the potential effects of stellar winds on gas residing in the belts of debris discs (as is predicted to occur in our own Kuiper belt, Kral et al. 2021) and identify that winds are expected in discs with L* > 20 L⊙, in which case the gas will form a wind rather than a disc. Stellar winds may also occur in systems with a luminosity below this criterion in low density environments (ncrit ≈10−3 cm−3, Kral et al. 2023). The latter scenario would apply in the case of HD 126062. Our SED fit constrains the stellar luminosity to 15.5 L⊙. However, the spectrum of an emission line tracing such a wind is expected to be broad, as was detected in the Class III system NO Lup (Lovell et al. 2021), or further offset with respect to the system velocity (e.g. the wind in η Tel, with components blue shifted by ≈17 − 23 km/s shown by Youngblood et al. 2021). Nonetheless, we note a dependence on inclination of the source. Whilst η Tel is highly inclined, HD 126062 is close to face on, so a wind cannot be entirely ruled out based on velocity alone. Kinematic analysis of gas emission can indicate relative motions of the gas, which can be compared to the predictions from models of belt winds. In the case of HD 126062, this may be difficult, as radiatively driven winds have a velocity vector in the radial direction, which for a nearly face-on disc will be projected as almost perpendicular to the line of sight of the observer, minimising any observable Doppler shift. The CO spectrum of HD 126062 is very narrow, with a line width of ≈2 km/s compared to that of NO Lup ≈20km/s (Lovell et al. 2021), and so future follow-up observations should leverage the finest possible spectral resolution in order to resolve the gas emission in the vicinity of HD 126062, so that further investigation can be undertaken.
The moment 8 map in Figure 4 is somewhat reminiscent of the double spirals that can appear in the aftermath of a flyby interaction (see e.g. Cuello et al. 2020); however, we lack a culprit companion with which HD 126062 could have interacted. The closest sources to HD 126062 on the sky are two stars at ≈7″, but the proper motions and parallaxes of these two stars are inconsistent with membership of the association Luhman (2022). Additionally the potential companion candidates identified in SPHERE data were also classified as background objects (Matthews et al. 2018).
4.3.2 Alternative explanations
Given the lack of clear ‘smoking-gun’ evidence tying the gas to the system of HD 126062, we must also consider the possibility that the gas emission is not in fact associated with HD 126062 at all. A similar situation was identified in observations of HR 8799, whereby 12CO emission was detected by ALMA within the field of view, but was attributed to background cloud HLCG 92-35 (Faramaz et al. 2021).
The spectrum of the 12CO emission is shifted slightly in the negative direction, with the peak occurring at −1 km/s LSRK. But as shown in Figure 4 the systemic velocity of the source is at 7.2 km/s. If the gas emission was associated with the debris disc it would be expected to possess the same velocity as the star. This displacement in velocity space is more consistent with a scenario in which the gas emission is not associated with HD 126062. The fact that the line is resolved across three channels makes it unlikely that the feature results from incorrect telluric correction, as this is typically a much narrower feature (<30 kHz) which would have no velocity shift and would appear ubiquitous and extended in the image. Having inspected the Tsys and bandpass calibration, there is no evidence of a telluric line or of any calibration artifact. Furthermore, other targets observed within the same scheduling block do not show a similar feature and the line is detected in both of the individual observations, which makes it very unlikely that the emission is a bandpass artifact. It could be that the emission originates from a background cloud. If the velocity offset from the rest frequency of 12CO (2–1) was a result of movement due to Galactic rotation, we would be able to pinpoint the distance to this emitting cloud. However, the small shift of the line spectrum of −1 km/s from the rest frequency of 12CO is not consistent with anything that is predicted when considering the Galaxy's rotation curve as measured in the literature (for example, Reid et al. 2019; Eilers et al. 2019). Cloud-to-cloud dispersion velocities are often measured as being of order a few kilometres per second (Wilson et al. 2011; Sun et al. 2020; Spilker et al. 2022), and so a relatively low offset such as −1 km/s could easily result from peculiar motion in such a cloud as viewed along the line of sight of the observer, but in this case we cannot know its relative distance from Earth. There is also the possibility that the emission could originate from a foreground or background object, but the lack of emission in the centre of the image where the debris disc resides, makes it difficult to imagine a foreground object that could produce such a morphology, other than diffuse clouds either in the vicinity of the star or along the line of sight.
Both the continuum emission from the debris disc and the extended 12CO emission are centred on the stellar position, but this does not necessitate that the two emission structures originate from the same object (as was seen towards HR 8799 by Faramaz et al. 2021). Whilst the origin and nature of the extended gas emission remains unclear with current data, targeted followup observations will be able to distinguish between, or rule-out some of the possibilities discussed in this section. High spectral resolution observations would enable investigation into the kinematic motion of the gas which could shed light on the nature of the emitting object. Higher angular resolution observations would provide a more precise mapping of the morphology of the brightness distribution in the emitting object, which would help identify it.
5 Conclusions
In this work, we have presented ALMA continuum imaging that has detected the exoKuiper belt around HD 126062 at millimetre wavelengths for the first time. Using MCMC sampling we made fits of a Gaussian ring morphology to the observed visibilities, finding a relatively face-on configuration with an inclination of ≤17°. The observed visibilities are consistent with a model of a Gaussian ring with a radial separation of the ring from the stellar position of ![Mathematical equation: $\[2.01_{-0.05}^{+0.04 \prime\prime}\]$](/articles/aa/full_html/2025/11/aa54463-25/aa54463-25-eq17.png) and a standard deviation of
and a standard deviation of ![Mathematical equation: $\[0.30_{-0.04}^{+0.04 \prime\prime}\]$](/articles/aa/full_html/2025/11/aa54463-25/aa54463-25-eq18.png) . Considering the distance to HD 126062 and converting the standard deviation of the Gaussian ring to a full width at half maximum, the exoKuiper parameters can be expressed in spatial units with a radius of
. Considering the distance to HD 126062 and converting the standard deviation of the Gaussian ring to a full width at half maximum, the exoKuiper parameters can be expressed in spatial units with a radius of ![Mathematical equation: $\[R=270_{-4}^{+5}\]$](/articles/aa/full_html/2025/11/aa54463-25/aa54463-25-eq19.png) au and a width of ΔR = 95 ± 12 au. This is one of the largest known exoKuiper belts to be resolved at millimetre wavelengths to date.
au and a width of ΔR = 95 ± 12 au. This is one of the largest known exoKuiper belts to be resolved at millimetre wavelengths to date.
In addition to the exoKuiper belt, a second warm component to the HD 126062 debris disc is required to achieve an accurate fit to the SED of the object, which we update with the new 1.3 mm photometric point. Our two-temperature blackbody fit predicts this inner component to be found at 22±6 au.
We detect extended 12CO emission in the vicinity of the star and debris disc, where the majority of gas line mission is situated externally to the exoKuiper belt we have detected. The exact nature of the 12CO emission remains unclear, but it seems most likely that the gas is not associated with HD 126062. Future observations are required to confirm the current working hypothesis.
Using the newly constrained dust distribution in the HD 126062 debris disc, we put limits on the mass of a potential unseen planet that could carve such a configuration through their orbital motion. Considering the constraints set by previous, unsuccessful planet searches, the dust distribution we observed in HD 126062 is consistent with sculpting by planets with a sub-Jovian planet (≲MJ) that has migrated significantly through the disc. Alternatively, a number of smaller planets could exist within the gap in this dust distribution.
Future observations of this object are strongly encouraged in order to more closely characterise the distribution of dust in the debris disc and to further study the 12CO gas that appears near HD 126062 in the images presented here. Specifically, deeper millimetre or sub-millimetre observations with high angular resolution should seek to precisely define the width and eccentricity of the exoKuiper belt, detect the predicted inner component of the debris disc, and further investigate the true nature of the 12CO emission in the vicinity of HD 126062.
Acknowledgements
This paper makes use of the following ALMA data: ADS/JAO.ALMA#2022.1.00968.S. ALMA is a partnership of ESO (representing its member states), NSF (USA) and NINS (Japan), together with NRC (Canada), NSTC and ASIAA (Taiwan), and KASI (Republic of Korea), in cooperation with the Republic of Chile. The Joint ALMA Observatory is operated by ESO, AUI/NRAO and NAOJ. This research made use of numpy (Harris et al. 2020) and Astropy2, a community-developed core Python package for Astronomy (The Astropy Collaboration 2013, 2018) and the SIMBAD database, operated at CDS, Strasbourg, France. The authors would additionally like to thank Elisabeth Matthews for discussions on the SPHERE observations of HD 126062 and Seiji Kameno for his insight on telluric features in ALMA data. The authors acknowledge support from ANID – Millennium Science Initiative Program – Center Code NCN2024_001. J.M. acknowledges support from FONDECYT de Postdoctorado 2024 #3240612. A.R. has been supported by the UK Science and Technology Facilities Council (STFC) via the consolidated grant ST/W000997/1 and by the European Union’s Horizon 2020 research and innovation programme under the Marie Sklodowska-Curie grant agreement No. 823823 (RISE DUSTBUSTERS project). TJH acknowledges UKRI guaranteed funding for a Horizon Europe ERC consolidator grant (EP/Y024710/1) and a Royal Society Dorothy Hodgkin Fellowship. J.M. additionally wishes to thank Instituto Roca Negra for their hospitality and fruitful discussions during the conception of this investigation.
References
- Acke, B., Min, M., Dominik, C., et al. 2012, A&A, 540, A125 [NASA ADS] [CrossRef] [EDP Sciences] [Google Scholar]
- Andrews, S. M., Terrell, M., Tripathi, A., et al. 2018, ApJ, 865, 157 [Google Scholar]
- Arce-Tord, C., Casassus, S., Dent, W. R., et al. 2023, MNRAS, 526, 2077 [NASA ADS] [CrossRef] [Google Scholar]
- Bailer-Jones, C. A. L., Rybizki, J., Fouesneau, M., Demleitner, M., & Andrae, R. 2021, AJ, 161, 147 [Google Scholar]
- Baraffe, I., Chabrier, G., Barman, T. S., Allard, F., & Hauschildt, P. H. 2003, A&A, 402, 701 [NASA ADS] [CrossRef] [EDP Sciences] [Google Scholar]
- Bohn, A. J., Benisty, M., Perraut, K., et al. 2022, A&A, 658, A183 [NASA ADS] [CrossRef] [EDP Sciences] [Google Scholar]
- Booth, M., Kennedy, G., Sibthorpe, B., et al. 2013, MNRAS, 428, 1263 [Google Scholar]
- Booth, M., Jordán, A., Casassus, S., et al. 2016, MNRAS, 460, 10 [Google Scholar]
- Brown, A. G. A., Vallenari, A., Prusti, T., et al. 2021, A&A, 649, A1 [NASA ADS] [CrossRef] [EDP Sciences] [Google Scholar]
- Cataldi, G., Aikawa, Y., Iwasaki, K., et al. 2023, ApJ, 951, 111 [NASA ADS] [CrossRef] [Google Scholar]
- Chabrier, G., Brassard, P., Fontaine, G., & Saumon, D. 2000, ApJ, 543, 216 [Google Scholar]
- Chen, C. H., Pecaut, M., Mamajek, E. E., Su, K. Y., & Bitner, M. 2012, ApJ, 756 [Google Scholar]
- Chen, C. H., Mittal, T., Kuchner, M., et al. 2014, ApJSS, 211 [Google Scholar]
- Cortes, P. C., Carpenter, J., Kameno, S., et al. 2025, ALMA Cycle 12 Technical Handbook, Tech. rep. [Google Scholar]
- Cuello, N., Louvet, F., Mentiplay, D., et al. 2020, MNRAS, 491, 504 [Google Scholar]
- Dent, W. R. F., Greaves, J. S., & Coulson, I. M. 2005, MNRAS, 359, 663 [NASA ADS] [CrossRef] [Google Scholar]
- Dent, W. R., Wyatt, M. C., Roberge, A., et al. 2014, Science, 343, 1490 [NASA ADS] [CrossRef] [Google Scholar]
- Eilers, A.-C., Hogg, D. W., Rix, H.-W., & Ness, M. K. 2019, ApJ, 871, 120 [Google Scholar]
- Faramaz, V., Marino, S., Booth, M., et al. 2021, AJ, 161, 271 [NASA ADS] [CrossRef] [Google Scholar]
- Foreman-Mackey, D., Hogg, D. W., Lang, D., & Goodman, J. 2013, PASP, 125, 306 [Google Scholar]
- Forgan, D., & Rice, K. 2011, MNRAS, 417, 1928 [NASA ADS] [CrossRef] [Google Scholar]
- Friebe, M. F., Pearce, T. D., & Löhne, T. 2022, MNRAS, 512, 4441 [Google Scholar]
- Gaia Collaboration (Vallenari, A., et al.) 2023, A&A, 674, A1 [NASA ADS] [CrossRef] [EDP Sciences] [Google Scholar]
- Gáspár, A., Wolff, S. G., Rieke, G. H., et al. 2023, Nat. Ast. 7, 790 [Google Scholar]
- Gelman, A., & Rubin, D. B. 1992, Statistical Science, 7, 457 [Google Scholar]
- Harris, C. R., Millman, K. J., van der Walt, S. J., et al. 2020, Nature, 585, 357 [NASA ADS] [CrossRef] [Google Scholar]
- Högbom, J. A. 1974, A&ASS, 15, 417 [Google Scholar]
- Holland, W. S., Greaves, J. S., Zuckerman, B., et al. 1998, Nature, 392, 788 [Google Scholar]
- Hughes, A. M., Lieman-Sifry, J., Flaherty, K. M., et al. 2017, ApJ, 839, 86 [NASA ADS] [CrossRef] [Google Scholar]
- Ida, S., Bryden, G., Lin, D. N. C., & Tanaka, H. 2000, ApJ, 534, 428 [NASA ADS] [CrossRef] [Google Scholar]
- Johnson, J. A., Aller, K. M., Howard, A. W., & Crepp, J. R. 2010, PASP, 122, 905 [Google Scholar]
- Kennedy, G. M., & Wyatt, M. C. 2014, MNRAS, 444, 3164 [NASA ADS] [CrossRef] [Google Scholar]
- Kepley, A. A., Tsutsumi, T., Brogan, C. L., et al. 2020, PASP, 132, 024505 [Google Scholar]
- Kospal, A., Moor, A., Juhasz, A., et al. 2013, ApJ, 776, 77 [CrossRef] [Google Scholar]
- Kral, Q., Marino, S., Wyatt, M. C., Kama, M., & Matrá, L. 2019, MNRAS, 489, 3670 [NASA ADS] [Google Scholar]
- Kral, Q., Davoult, J., & Charnay, B. 2020, Nat. Astron., 4, 769 [Google Scholar]
- Kral, Q., Pringle, J. E., Guilbert-Lepoutre, A., et al. 2021, A&A, 653, L11 [NASA ADS] [CrossRef] [EDP Sciences] [Google Scholar]
- Kral, Q., Pringle, J. E., Matrà, L., & Thébault, P. 2023, A&A, 669, A116 [NASA ADS] [CrossRef] [EDP Sciences] [Google Scholar]
- Kratter, K. M., Murray-Clay, R. A., & Youdin, A. N. 2010, ApJ, 710, 1375 [Google Scholar]
- Krivov, A. V., & Wyatt, M. C. 2021, MNRAS, 500, 718 [Google Scholar]
- Lagrange, A. M., Gratadour, D., Chauvin, G., et al. 2009, A&A, 493, 21 [Google Scholar]
- Lagrange, A.-M., Meunier, N., Rubini, P., et al. 2019, Nat. Astron., 3, 1135 [NASA ADS] [CrossRef] [Google Scholar]
- Launhardt, R., Henning, T., Quirrenbach, A., et al. 2020, A&A, 635, A162 [NASA ADS] [CrossRef] [EDP Sciences] [Google Scholar]
- Lieman-Sifry, J., Hughes, A. M., Carpenter, J. M., et al. 2016, ApJ, 828, 25 [NASA ADS] [CrossRef] [Google Scholar]
- Lovell, J. B., & Lynch, E. M. 2023, MNRAS, 525, L36 [NASA ADS] [CrossRef] [Google Scholar]
- Lovell, J. B., Kennedy, G. M., Marino, S., et al. 2021, MNRAS, 502, L66 [NASA ADS] [CrossRef] [Google Scholar]
- Luhman, K. L. 2022, AJ, 163, 24 [NASA ADS] [CrossRef] [Google Scholar]
- Lynch, E. M., & Lovell, J. B. 2022, MNRAS, 510, 2538 [NASA ADS] [CrossRef] [Google Scholar]
- MacGregor, M. A., Matrà, L., Kalas, P., et al. 2017, ApJ, 842, 8 [CrossRef] [Google Scholar]
- MacGregor, M. A., Wilner, D. J., Rosenfeld, K. A., et al. 2013, APJ, 762 [Google Scholar]
- Marino, S., Matrà, L., Stark, C., et al. 2016, MNRAS, 460, 2933 [Google Scholar]
- Marino, S., Wyatt, M. C., Panić, O., et al. 2017, MNRAS, 465, 2595 [NASA ADS] [CrossRef] [Google Scholar]
- Marino, S., Flock, M., Henning, T., et al. 2020a, MNRAS, 492, 4409 [Google Scholar]
- Marino, S., Zurlo, A., Faramaz, V., et al. 2020b, MNRAS, 498, 1319 [Google Scholar]
- Marois, C., Macintosh, B., Barman, T., et al. 2008, Science, 322, 1348 [Google Scholar]
- Marois, C., Zuckerman, B., Konopacky, Q. M., Macintosh, B., & Barman, T. 2010, Nature, 468, 1080 [NASA ADS] [CrossRef] [Google Scholar]
- Marshall, J. P., Wang, L., Kennedy, G. M., Zeegers, S. T., & Scicluna, P. 2021, MNRAS, 501, 6168 [NASA ADS] [CrossRef] [Google Scholar]
- Matrà, L., MacGregor, M. A., Kalas, P., et al. 2017, ApJ, 842, 9 [Google Scholar]
- Matrà, L., Wyatt, M. C., Wilner, D. J., et al. 2019, AJ, 157, 135 [CrossRef] [Google Scholar]
- Matrà, L., Dent, W. R. F., Wilner, D. J., et al. 2020, ApJ, 898, 146 [CrossRef] [Google Scholar]
- Matrà, L., Marino, S., Wilner, D. J., et al. 2025, A&A, 693, A151 [NASA ADS] [CrossRef] [EDP Sciences] [Google Scholar]
- Matthews, E., Hinkley, S., Vigan, A., et al. 2018, MNRAS, 480, 2757 [NASA ADS] [CrossRef] [Google Scholar]
- Matthews, E. C., Bonnefoy, M., Xie, C., et al. 2023, A&A, 679, A58 [NASA ADS] [CrossRef] [EDP Sciences] [Google Scholar]
- Mayama, S., Akiyama, E., Panić, O., et al. 2018, ApJ, 868, L3 [NASA ADS] [CrossRef] [Google Scholar]
- Miley, J. M., Panić, O., Wyatt, M., & Kennedy, G. M. 2018, A&A, 615, L10 [NASA ADS] [CrossRef] [EDP Sciences] [Google Scholar]
- Moór, A., Abrahám, P., Kóspál, A., et al. 2013, ApJ, 775, L51 [CrossRef] [Google Scholar]
- Moór, A., Curé, M., Kóspál, A., et al. 2017, ApJ, 849, 123 [CrossRef] [Google Scholar]
- Nakatani, R., Kobayashi, H., Kuiper, R., Nomura, H., & Aikawa, Y. 2021, ApJ, 915, 90 [NASA ADS] [CrossRef] [Google Scholar]
- Nakatani, R., Turner, N. J., Hasegawa, Y., et al. 2023, ApJ, 959, L28 [NASA ADS] [CrossRef] [Google Scholar]
- Pascucci, I., Testi, L., Herczeg, G. J., et al. 2016, ApJ, 831, 125 [Google Scholar]
- Pawellek, N., & Krivov, A. V. 2015, MNRAS, 454, 3207 [Google Scholar]
- Pawellek, N., Wyatt, M., Matra, L., Kennedy, G., & Yelverton, B. 2021, MNRAS, 502, 5390 [NASA ADS] [CrossRef] [Google Scholar]
- Pearce, T. D., & Wyatt, M. C. 2014, MNRAS, 443, 2541 [NASA ADS] [CrossRef] [Google Scholar]
- Pearce, T. D., Launhardt, R., Ostermann, R., et al. 2022, A&A, 659, A135 [NASA ADS] [CrossRef] [EDP Sciences] [Google Scholar]
- Pecaut, M. J., & Mamajek, E. E. 2016, MNRAS, 461, 794 [Google Scholar]
- Péricaud, J., Di Folco, E., Dutrey, A., Guilloteau, S., & Piétu, V. 2017, A&A, 600, A62 [Google Scholar]
- Raymond, S. N., Armitage, P. J., Moro-Martín, A., et al. 2011, A&A, 530, A62 [NASA ADS] [CrossRef] [EDP Sciences] [Google Scholar]
- Rebollido, I., Stark, C. C., Kammerer, J., et al. 2024, AJ, 167, 28 [Google Scholar]
- Reffert, S., Bergmann, C., Quirrenbach, A., Trifonov, T., & Künstler, A. 2015, A&A, 574, A116 [NASA ADS] [CrossRef] [EDP Sciences] [Google Scholar]
- Reid, M. J., Menten, K. M., Brunthaler, A., et al. 2019, ApJ, 885, 131 [Google Scholar]
- Ribas, A., Merín, B., Bouy, H., & Maud, L. T. 2014, A&A, 561, A54 [NASA ADS] [CrossRef] [EDP Sciences] [Google Scholar]
- Spilker, A., Kainulainen, J., & Orkisz, J. 2022, A&A, 667, A110 [NASA ADS] [CrossRef] [EDP Sciences] [Google Scholar]
- Stapper, L. M., Hogerheijde, M. R., van Dishoeck, E. F., & Mentel, R. 2022, A&A, 658, A112 [NASA ADS] [CrossRef] [EDP Sciences] [Google Scholar]
- Stapper, L. M., Hogerheijde, M. R., van Dishoeck, E. F., et al. 2024, A&A, 682, A149 [NASA ADS] [CrossRef] [EDP Sciences] [Google Scholar]
- Sun, J., Leroy, A. K., Schinnerer, E., et al. 2020, ApJ, 901, L8 [NASA ADS] [CrossRef] [Google Scholar]
- Tazzari, M. 2017, Zenodo, v0.1.1, https://zenodo.org/records/1003113 [Google Scholar]
- Tazzari, M., Testi, L., Ercolano, B., et al. 2016, A&A, 588, A53 [NASA ADS] [CrossRef] [EDP Sciences] [Google Scholar]
- The Astropy Collaboration (Robitaille, T. P., et al.) 2013, A&A, 558, A33 [NASA ADS] [CrossRef] [EDP Sciences] [Google Scholar]
- The Astropy Collaboration (Price-Whelan, A. M., et al.) 2018, arXiv e-prints [arXiv:1801.02634] [Google Scholar]
- Trapman, L., Facchini, S., Hogerheijde, M. R., van Dishoeck, E. F., & Bruderer, S. 2019, A&A, 629, A79 [NASA ADS] [CrossRef] [EDP Sciences] [Google Scholar]
- Visser, R., van Dishoeck, E. F., & Black, J. H. 2009, A&A, 503, 323 [NASA ADS] [CrossRef] [EDP Sciences] [Google Scholar]
- White, J. A., Boley, A. C., Hughes, A. M., et al. 2016, ApJ, 829, 6 [NASA ADS] [CrossRef] [Google Scholar]
- Wilson, C. D., Warren, B. E., Irwin, J., et al. 2011, MNRAS, 410, 1409 [NASA ADS] [Google Scholar]
- Wyatt, M. C. 2008, ARA&A, 46, 339 [Google Scholar]
- Wyatt, M. C., Panić, O., Kennedy, G. M., & Matrà, L. 2015, ApJSS, 357, 103 [Google Scholar]
- Yang, Q., Liu, Q., Kennedy, G. M., et al. 2024, A&A, 686, A206 [NASA ADS] [CrossRef] [EDP Sciences] [Google Scholar]
- Yelverton, B., Kennedy, G. M., Su, K. Y., & Wyatt, M. C. 2019, MNRAS, 488, 3588 [Google Scholar]
- Youngblood, A., Roberge, A., MacGregor, M. A., et al. 2021, AJ, 162, 235 [NASA ADS] [CrossRef] [Google Scholar]
These calculations are made using the general, or ‘exact’ Equation (8) from Friebe et al. (2022), rather than the simplified version. The latter form nevertheless yields similar results and is valid for the majority of cases where migration is weak.
Appendix A Model fit to the continuum visibilities
We employed Markov chain Monte Carlo sampling, through the package emcee (Foreman-Mackey et al. 2013), to sample the parameter space whilst applying a Gaussian ring model, as described by Equation 1, to the de-projected observed visibilities. The representative model, which takes the median values (50th percentile), is used to construct the model included in Figure 1 and the subsequent residual map.
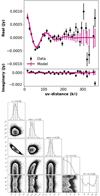 |
Fig. A.1 Top: Comparison of the real and imaginary components of the representative model as a function of uv distance with the observed visibilities in Fourier space. Error bars show the standard deviation of the visibilities in each radial bin. Bottom: Corner plot of the posterior distributions from the fit of our brightness distribution model to the observed visibilities. The values adopted for our representative model are given in the titles for each of the parameters as the 50th percentile of the posterior distribution, with error bars taken as the 16th and 84th percentile. |
Appendix B Channel maps from the 12CO cube
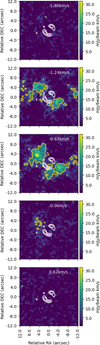 |
Fig. B.1 Channel maps showing the 12CO emission. The white lines show the continuum emission from the image where a uvtaper was applied, plotted at contours of 3,4×σcont. Yellow contours show the 5×σCO level in individual channels. |
All Tables
Specific masses calculated for planets capable of carving the HD 126062 dust distribution through their orbital motion when assuming a circular orbit and a range of potential initial disc masses.
All Figures
|
Fig. 1 Top row: fiducial image of the continuum observations of HD 126062 reconstructed using tclean with natural weighting (left). Gaussian ring model derived from the MCMC fit to the visibilities (middle). Residual image following the subtraction of the model from the data, restored using the same imaging parameters as the tclean image (right). Bottom row: same as the top row, except tclean images have been reconstructed with a uvtaper of |
| In the text | |
|
Fig. 2 Fit to the SED of HD 126062 comprised of two blackbody components and a stellar contribution. Error bars are included but are smaller than the data point markers. |
| In the text | |
|
Fig. 3 Integrated intensity (moment-0) map of the 12CO (2–1) transition observed towards HD 126062. Emission above 3σ in the channels was used to construct this moment map. White contours show the continuum image constructed with a uvtaper. The beam size is indicated in the lower left corner. |
| In the text | |
|
Fig. 4 Top: 12CO spectra extracted from different regions of the image. The disc region is found within R+ΔR; the external region begins at R+ΔR and extends as far as 3σ emission is detected in the moment 0 map (≈12″). The total encompasses both of these regions. The systemic velocity as measured by Gaia is indicated by a vertical line. Bottom: moment 8 map of 12CO emission, which collapses the cube in the spectral axis and shows the peak emission for each pixel in the cube. |
| In the text | |
|
Fig. 5 exoKuiper belt positions as characterised by the REASONS survey, plotted as a function of the stellar luminosity of their host, where error bars indicate ΔR as derived by the given references. HD 126062 is also plotted, using the stellar luminosity as derived from the SED fitting in this work. We also plot distance-stellar luminosity relations, R ∝ Lα fit to samples of discs observed in the millimetere (Matrà et al. 2019) and far-IR (Marshall et al. 2021). |
| In the text | |
|
Fig. 6 Gap widths opened by different masses of orbiting exoplanets calculated for four different values of the initial debris disc mass. The horizontal line shows the target gap width, which has been measured from the dust distribution as defined by this work. The dotted line shows the result for a case in which there is no migration from the planet and the shaded area indicates the calculated uncertainty on the target gap width in the system. |
| In the text | |
|
Fig. A.1 Top: Comparison of the real and imaginary components of the representative model as a function of uv distance with the observed visibilities in Fourier space. Error bars show the standard deviation of the visibilities in each radial bin. Bottom: Corner plot of the posterior distributions from the fit of our brightness distribution model to the observed visibilities. The values adopted for our representative model are given in the titles for each of the parameters as the 50th percentile of the posterior distribution, with error bars taken as the 16th and 84th percentile. |
| In the text | |
|
Fig. B.1 Channel maps showing the 12CO emission. The white lines show the continuum emission from the image where a uvtaper was applied, plotted at contours of 3,4×σcont. Yellow contours show the 5×σCO level in individual channels. |
| In the text | |
Current usage metrics show cumulative count of Article Views (full-text article views including HTML views, PDF and ePub downloads, according to the available data) and Abstracts Views on Vision4Press platform.
Data correspond to usage on the plateform after 2015. The current usage metrics is available 48-96 hours after online publication and is updated daily on week days.
Initial download of the metrics may take a while.