Fig. 4
Download original image
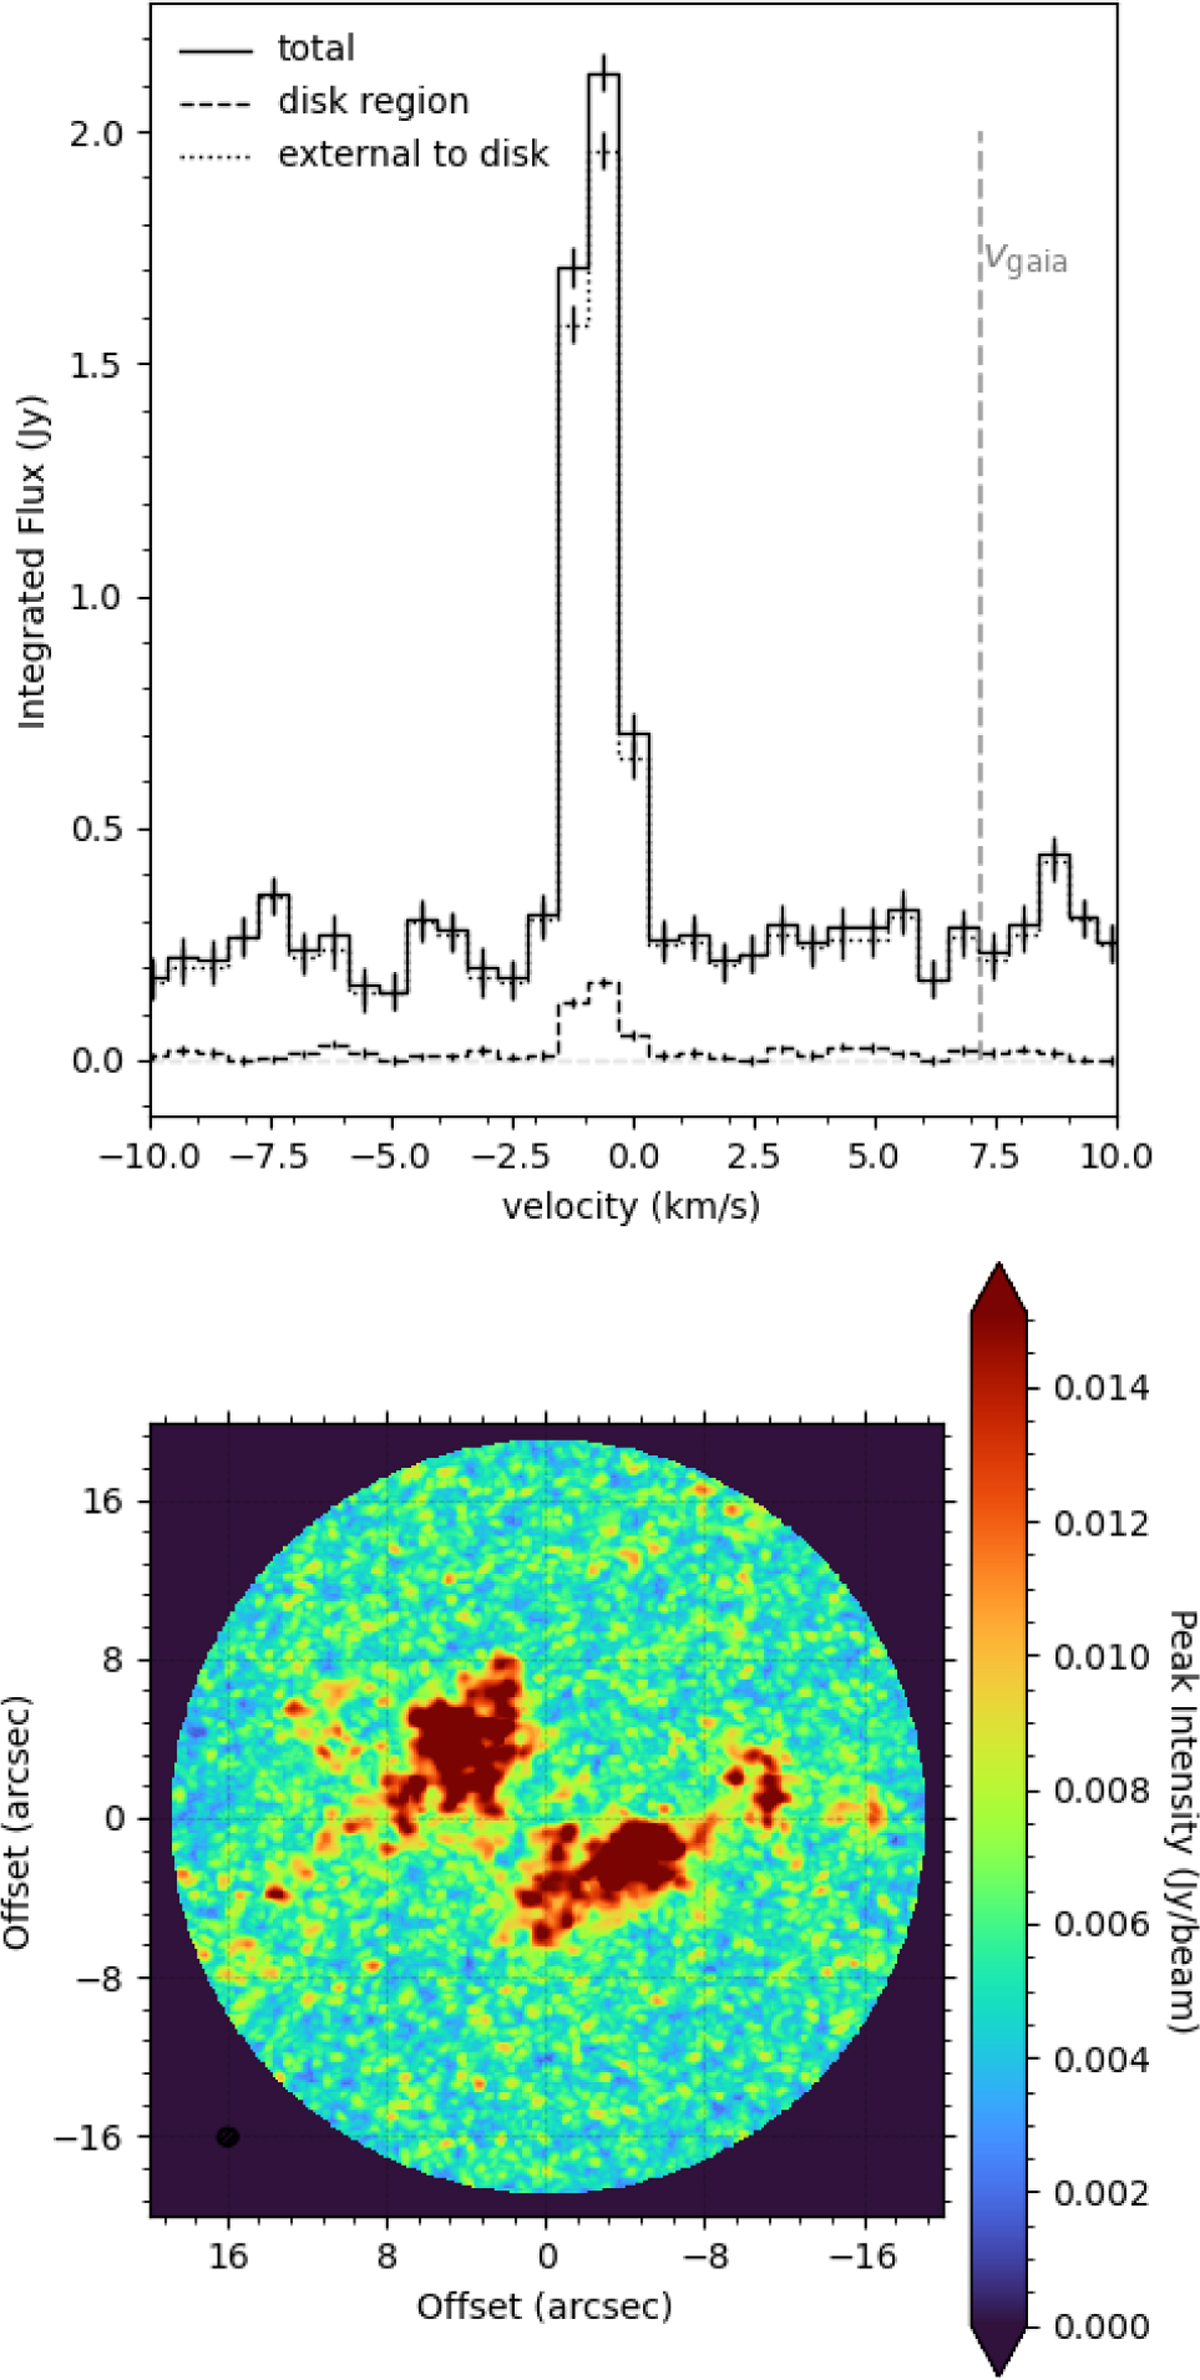
Top: 12CO spectra extracted from different regions of the image. The disc region is found within R+ΔR; the external region begins at R+ΔR and extends as far as 3σ emission is detected in the moment 0 map (≈12″). The total encompasses both of these regions. The systemic velocity as measured by Gaia is indicated by a vertical line. Bottom: moment 8 map of 12CO emission, which collapses the cube in the spectral axis and shows the peak emission for each pixel in the cube.
Current usage metrics show cumulative count of Article Views (full-text article views including HTML views, PDF and ePub downloads, according to the available data) and Abstracts Views on Vision4Press platform.
Data correspond to usage on the plateform after 2015. The current usage metrics is available 48-96 hours after online publication and is updated daily on week days.
Initial download of the metrics may take a while.