Fig. A.1
Download original image
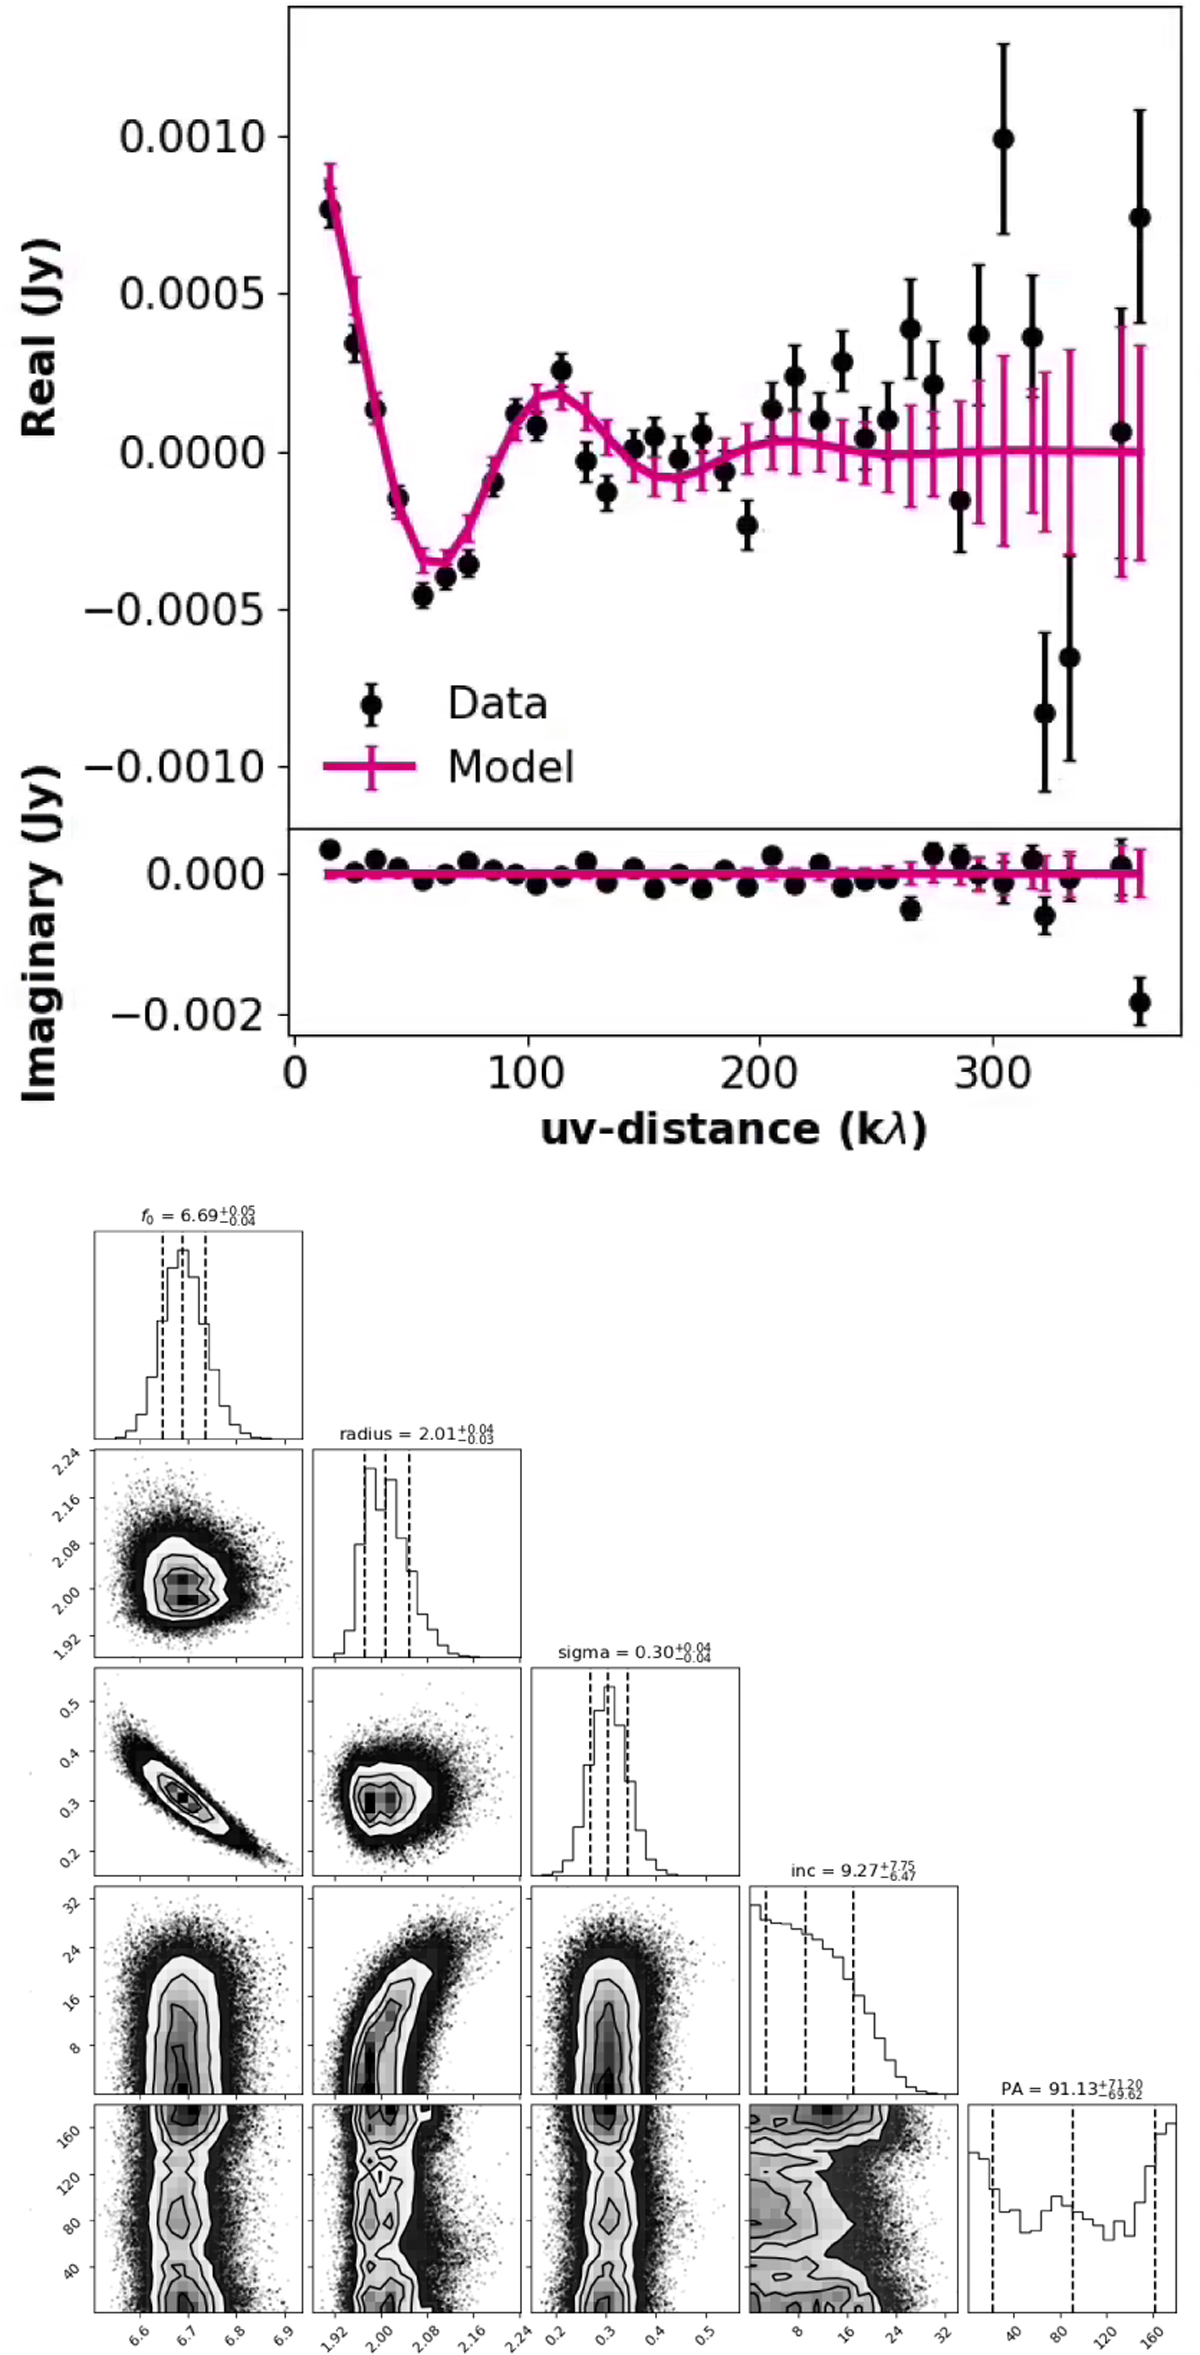
Top: Comparison of the real and imaginary components of the representative model as a function of uv distance with the observed visibilities in Fourier space. Error bars show the standard deviation of the visibilities in each radial bin. Bottom: Corner plot of the posterior distributions from the fit of our brightness distribution model to the observed visibilities. The values adopted for our representative model are given in the titles for each of the parameters as the 50th percentile of the posterior distribution, with error bars taken as the 16th and 84th percentile.
Current usage metrics show cumulative count of Article Views (full-text article views including HTML views, PDF and ePub downloads, according to the available data) and Abstracts Views on Vision4Press platform.
Data correspond to usage on the plateform after 2015. The current usage metrics is available 48-96 hours after online publication and is updated daily on week days.
Initial download of the metrics may take a while.