Fig. 9
Download original image
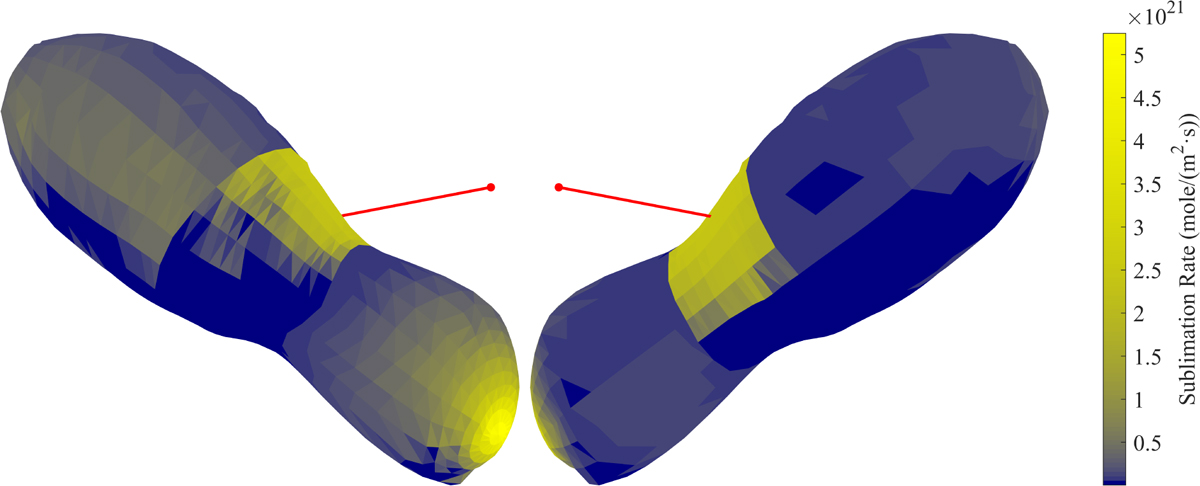
Distribution of volatile sublimation rates on the nucleus surface. The sublimation rate of CO2 is displayed for the end regions, while the sublimation rate of H2O is shown for the waist region. The nucleus’s attitude and observation direction are set to E+7 minutes to align with EPOXI observation data. The left graph shows the front side distribution, and the right graph shows the reverse side distribution. The red line indicates the solar direction.
Current usage metrics show cumulative count of Article Views (full-text article views including HTML views, PDF and ePub downloads, according to the available data) and Abstracts Views on Vision4Press platform.
Data correspond to usage on the plateform after 2015. The current usage metrics is available 48-96 hours after online publication and is updated daily on week days.
Initial download of the metrics may take a while.