Fig. A.1
Download original image
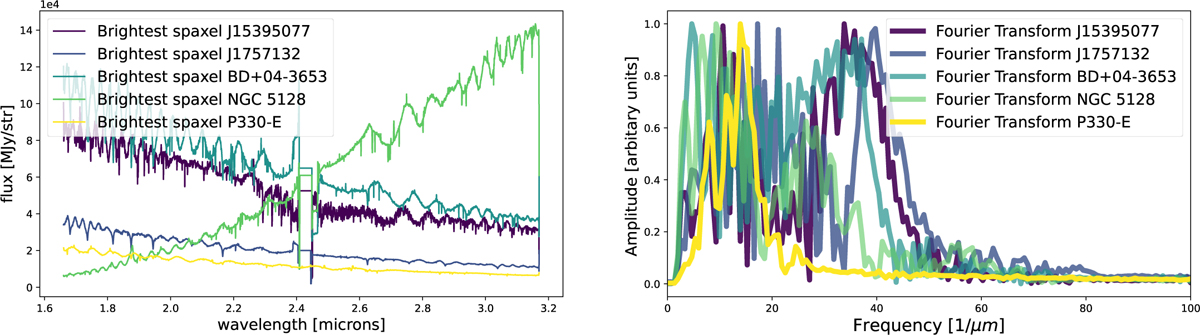
Brightest spaxels spectrum (left) and Fourier power spectra of the wiggle spectrum (right) for all the NIRSpec IFU data used in this work. The high-resolution datasets show two distinct peaks associated with wiggles at characteristic frequencies of ~20 µm−1 and ~40 µm−1. In contrast, medium-resolution data (e.g., P330-E, used in Law et al. (2023)) only show the lower-frequency component, indicating that the 40 µm−1 peak is unique to high-resolution modes.
Current usage metrics show cumulative count of Article Views (full-text article views including HTML views, PDF and ePub downloads, according to the available data) and Abstracts Views on Vision4Press platform.
Data correspond to usage on the plateform after 2015. The current usage metrics is available 48-96 hours after online publication and is updated daily on week days.
Initial download of the metrics may take a while.