Fig. 3
Download original image
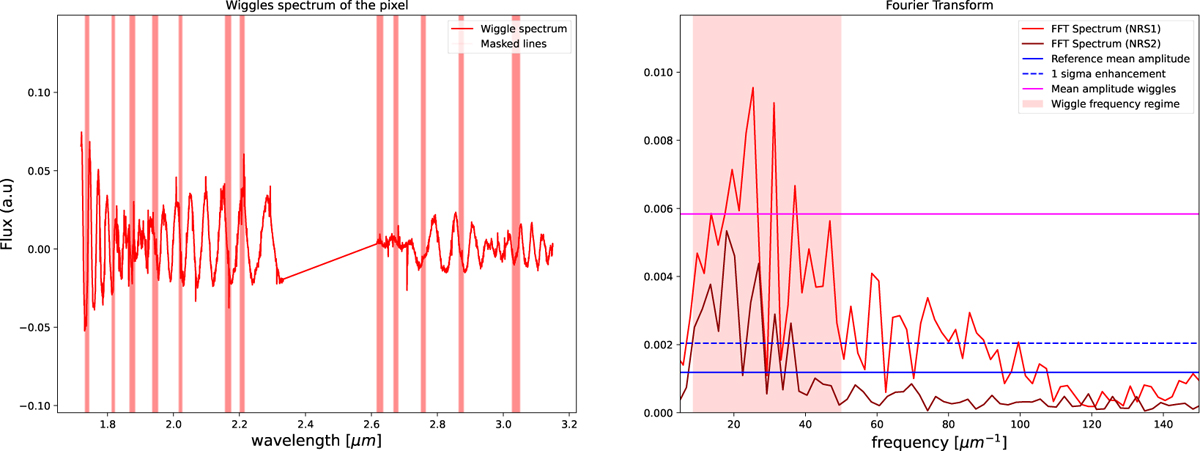
Example of a wiggle spectrum and its fast Fourier transform for the spectrum of J1757132. The fast Fourier transform is used in WICKED to flag spaxels in the data cube affected by wiggles. The built-in method PLOT_WIGGLE_FFT in WICKED allows for manual examination of the spectrum and its Fourier transform for a specific spaxel in the data cube. The left panel shows the wiggle spectrum created by subtracting the spectrum from the best-fit model. The right panel shows the Fourier transform of the wiggle spectrum. The solid fuchsia line represents the mean amplitude in the wiggle-dominated part of the spectrum (shaded red region). WICKED flags the spaxels by comparing the mean amplitude to the standard deviation (blue dashed line). If the data from the two NRS detectors are available, as in this case, WICKED determines which part of the spectrum shows the most prominent wiggles and bases the flagging on that part of the spectrum.
Current usage metrics show cumulative count of Article Views (full-text article views including HTML views, PDF and ePub downloads, according to the available data) and Abstracts Views on Vision4Press platform.
Data correspond to usage on the plateform after 2015. The current usage metrics is available 48-96 hours after online publication and is updated daily on week days.
Initial download of the metrics may take a while.