Fig. 4
Download original image
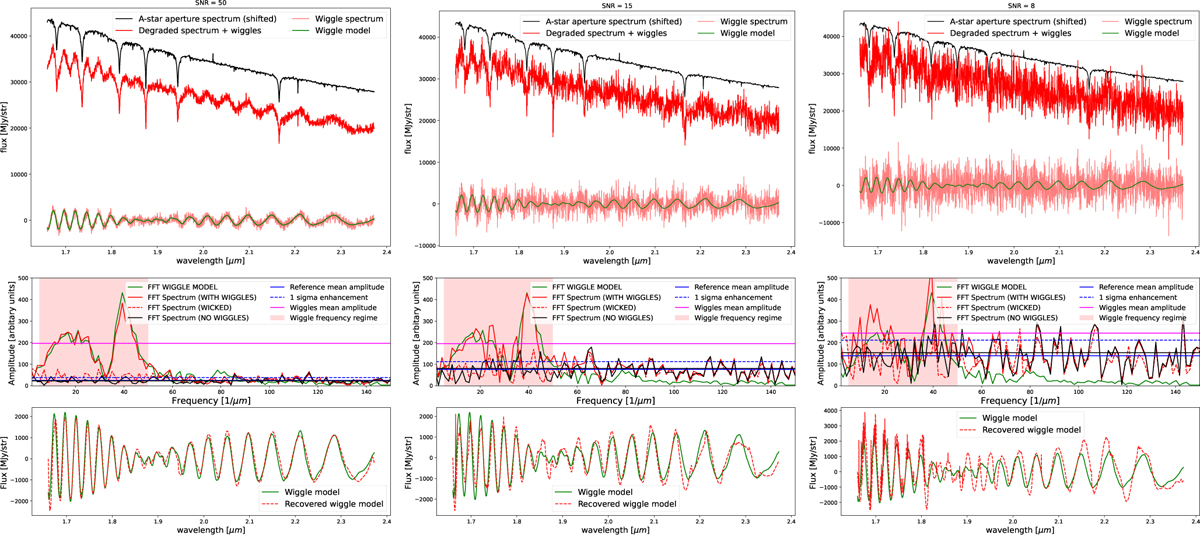
Comparison of the spectrum of the A-star J1757132 (top, black) and the degraded spectrum (top, red) with the added wiggle model (green) at S/N ratios of 50, 15, and 8. Middle: Fourier spectra of (i) the degraded spectrum (solid, red), (ii) the wiggle model (green), (iii) the degraded spectrum without wiggles (black), and iv) the data corrected with WICKED (dashed, red). The horizontal lines mark the mean amplitude of the Fourier spectrum at frequencies dominated by wiggles and at larger frequencies. The Fourier ratio can effectively distinguish wiggles from noise down to a S/N ratio of ~8. Bottom: comparison of the input wiggle model (green) versus the recovered wiggle spectrum for the data cleaned with WICKED.
Current usage metrics show cumulative count of Article Views (full-text article views including HTML views, PDF and ePub downloads, according to the available data) and Abstracts Views on Vision4Press platform.
Data correspond to usage on the plateform after 2015. The current usage metrics is available 48-96 hours after online publication and is updated daily on week days.
Initial download of the metrics may take a while.