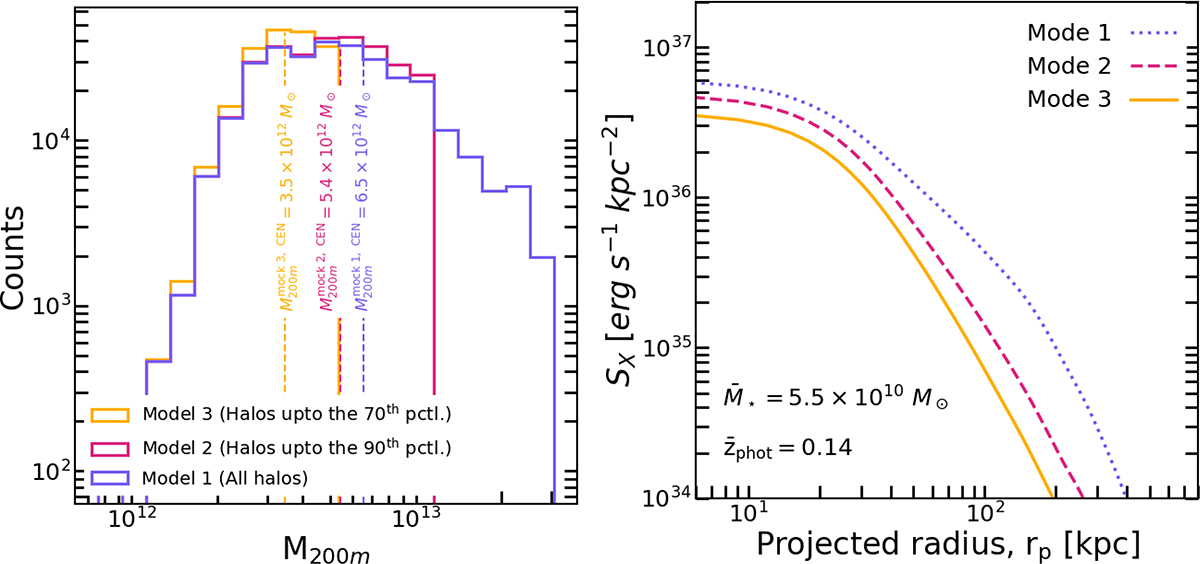
Fig. 1.
Download original image
Forward models constructed in this work for the hot CGM from central galaxies by varying the underlying halo mass distribution. Left panel: Purple halo mass distribution (Model 1) obtained from the mock central galaxy catalog – constructed with the TNG300 lightcone (LC-TNG300) from Shreeram et al. (2025) – for the X-ray stack from Z24 that uses optically detected galaxies with photometric redshifts (Fullphot) from LS DR9 (Dey et al. 2019). Note that the mock galaxy catalog is generated by matching LC-TNG300 to Fullphot in stellar mass and redshift (see details in Sect. 3.3); the median stellar mass and redshift of the Fullphot (and our mock catalogs) are 5.5 × 10¹⁰ M⊙ and 0.14, respectively. The underlying halo mass distribution of the Fullphot optical dataset is unknown. The pink distribution (Model 2; with mean M200m = 5.4 × 10¹² M⊙) discards the top 10% most massive halos before the generation of the mock galaxy catalog. The yellow distribution (Model 3; with mean M200m = 3.5 × 10¹² M⊙) discards the top 30% most massive halos before the generation of the mock galaxy catalog. Right panel: Corresponding X-ray surface brightness profiles in the 0.5 − 2 kev energy band (for details on their generation see Sect. 3.2) for the three mock galaxy catalogs with different halo mass distributions, which are shown in the left panel. The profiles are convolved with the eROSITA PSF, and they represent the Fullphot dataset in the stellar mass and redshift plane. Nevertheless, due to the impact of the underlying halo mass distribution, the shape and normalization of the hot CGM profiles are impacted, where discarding the most massive halos from the underlying halo distribution results in steeper profiles with lower normalizations.
Current usage metrics show cumulative count of Article Views (full-text article views including HTML views, PDF and ePub downloads, according to the available data) and Abstracts Views on Vision4Press platform.
Data correspond to usage on the plateform after 2015. The current usage metrics is available 48-96 hours after online publication and is updated daily on week days.
Initial download of the metrics may take a while.