Fig. 2.
Download original image
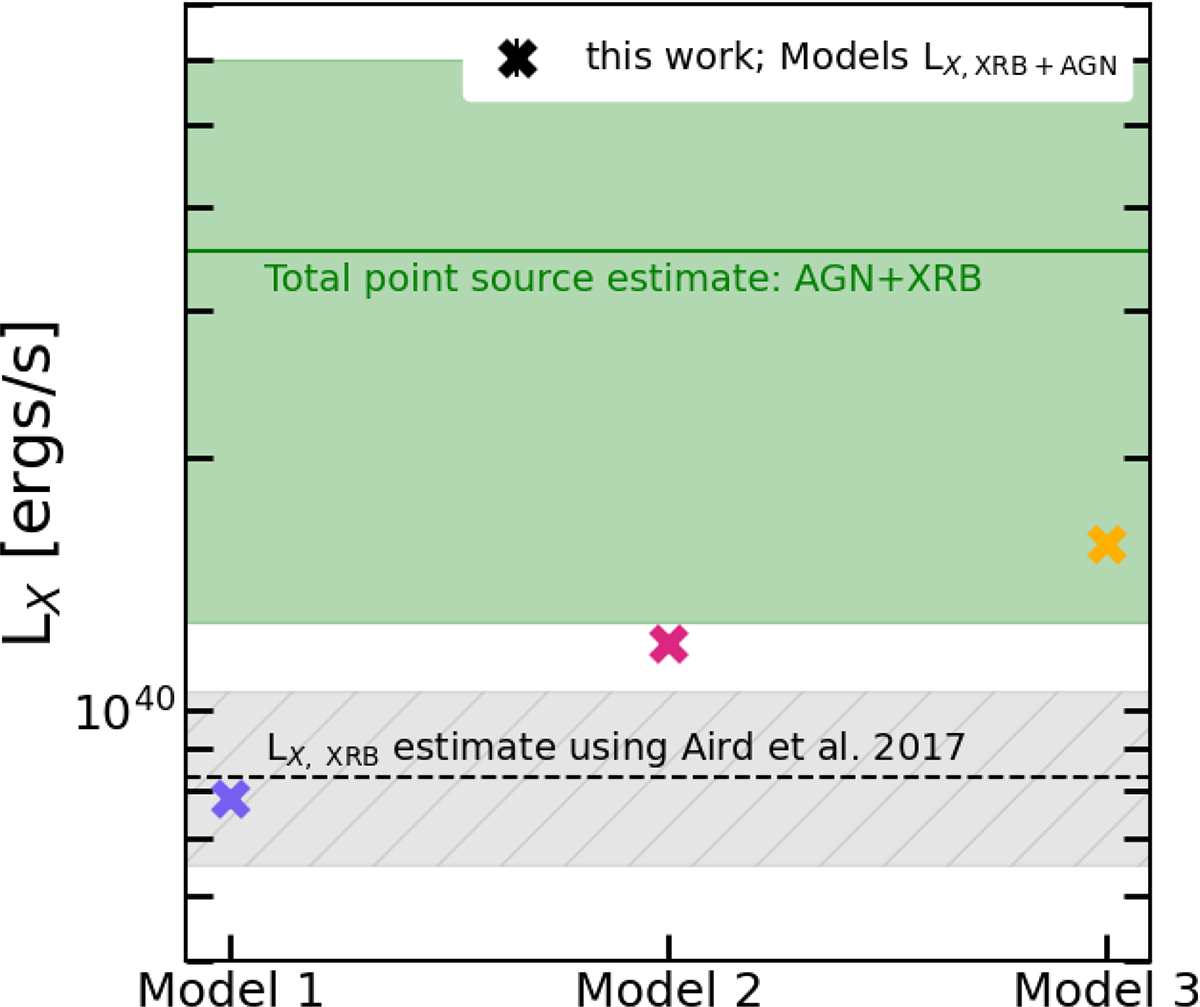
Comparison of the mean point source (AGN and XRB) luminosities from our three forward models (crosses, based on the different halo distributions shown in Fig. 1) with the empirically allowed range of XRB and total point source luminosities, as shown by the hatched gray region and the shaded green region, respectively. We estimate the contribution due to XRB emission using the Aird et al. (2017) model. For estimating the AGN luminosity budget, LX, AGN, we used the Aird et al. (2013) model for the incidence rate distribution as a function of the ![]() keV. To convert the 2 − 10 keV luminosity distribution in the 0.5 − 2 keV band, we used an empirical obscuration model from Comparat et al. (2019). For more details, see the text of Sects. 4.1 and 4.2. This comparison favors model 3, shown by the yellow cross, where the hot CGM component allows for a point source component with luminosity that agrees with empirical estimates from the low-redshift Universe.
keV. To convert the 2 − 10 keV luminosity distribution in the 0.5 − 2 keV band, we used an empirical obscuration model from Comparat et al. (2019). For more details, see the text of Sects. 4.1 and 4.2. This comparison favors model 3, shown by the yellow cross, where the hot CGM component allows for a point source component with luminosity that agrees with empirical estimates from the low-redshift Universe.
Current usage metrics show cumulative count of Article Views (full-text article views including HTML views, PDF and ePub downloads, according to the available data) and Abstracts Views on Vision4Press platform.
Data correspond to usage on the plateform after 2015. The current usage metrics is available 48-96 hours after online publication and is updated daily on week days.
Initial download of the metrics may take a while.