Fig. 3.
Download original image
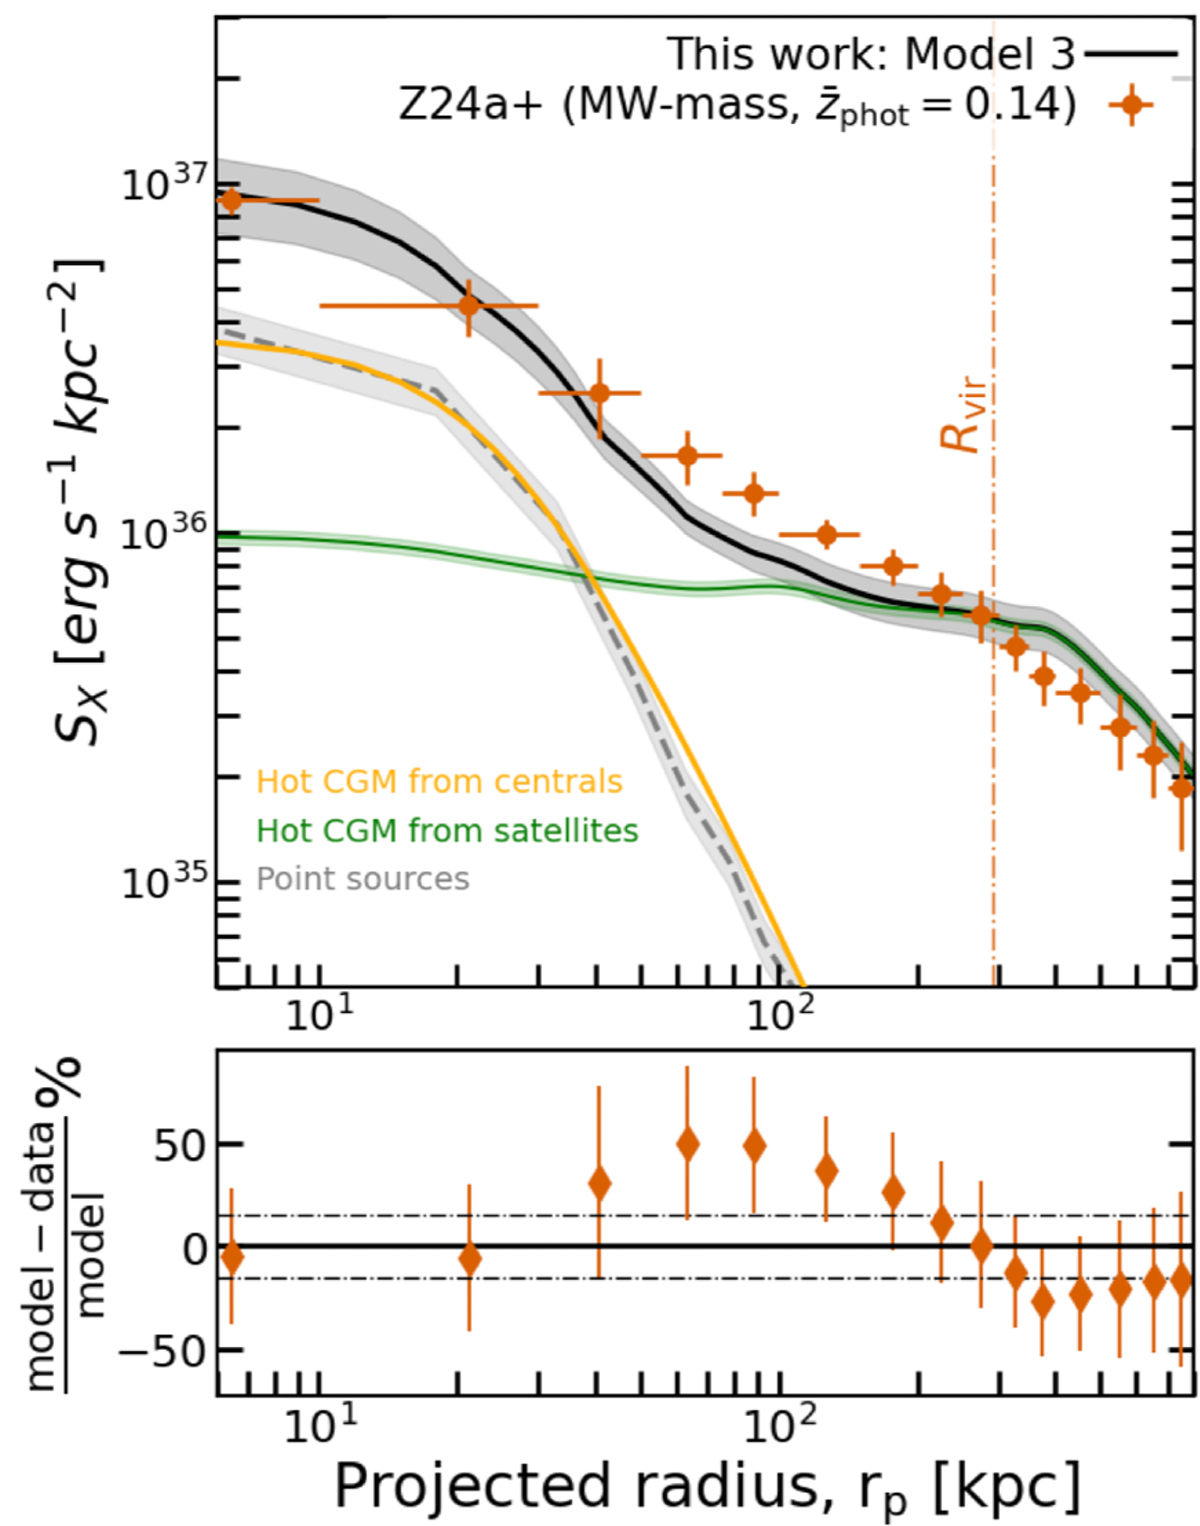
Decomposition of the X-ray stack of the galaxies in the photometric sample, Fullphot, into contributions from hot gas events (centrals and satellites hosted by more massive host halos) and point sources (AGNs and XRBs). The orange data points from Z24 are described with the model from this work (shown by the solid black line). The dash-dotted orange line at 292 kpc corresponds to the virial radius of the observational sample. The model is composed of the following: the hot CGM from central galaxies (yellow), the events around satellites probing the hot gas of their more massive host halos (green), and X-ray events from unresolved and resolved point-like sources comprising AGNs and XRBs (gray). The bottom panel shows the percentage deviation of the best-fit forward model from the data. The dash-dotted lines show the 15% level.
Current usage metrics show cumulative count of Article Views (full-text article views including HTML views, PDF and ePub downloads, according to the available data) and Abstracts Views on Vision4Press platform.
Data correspond to usage on the plateform after 2015. The current usage metrics is available 48-96 hours after online publication and is updated daily on week days.
Initial download of the metrics may take a while.