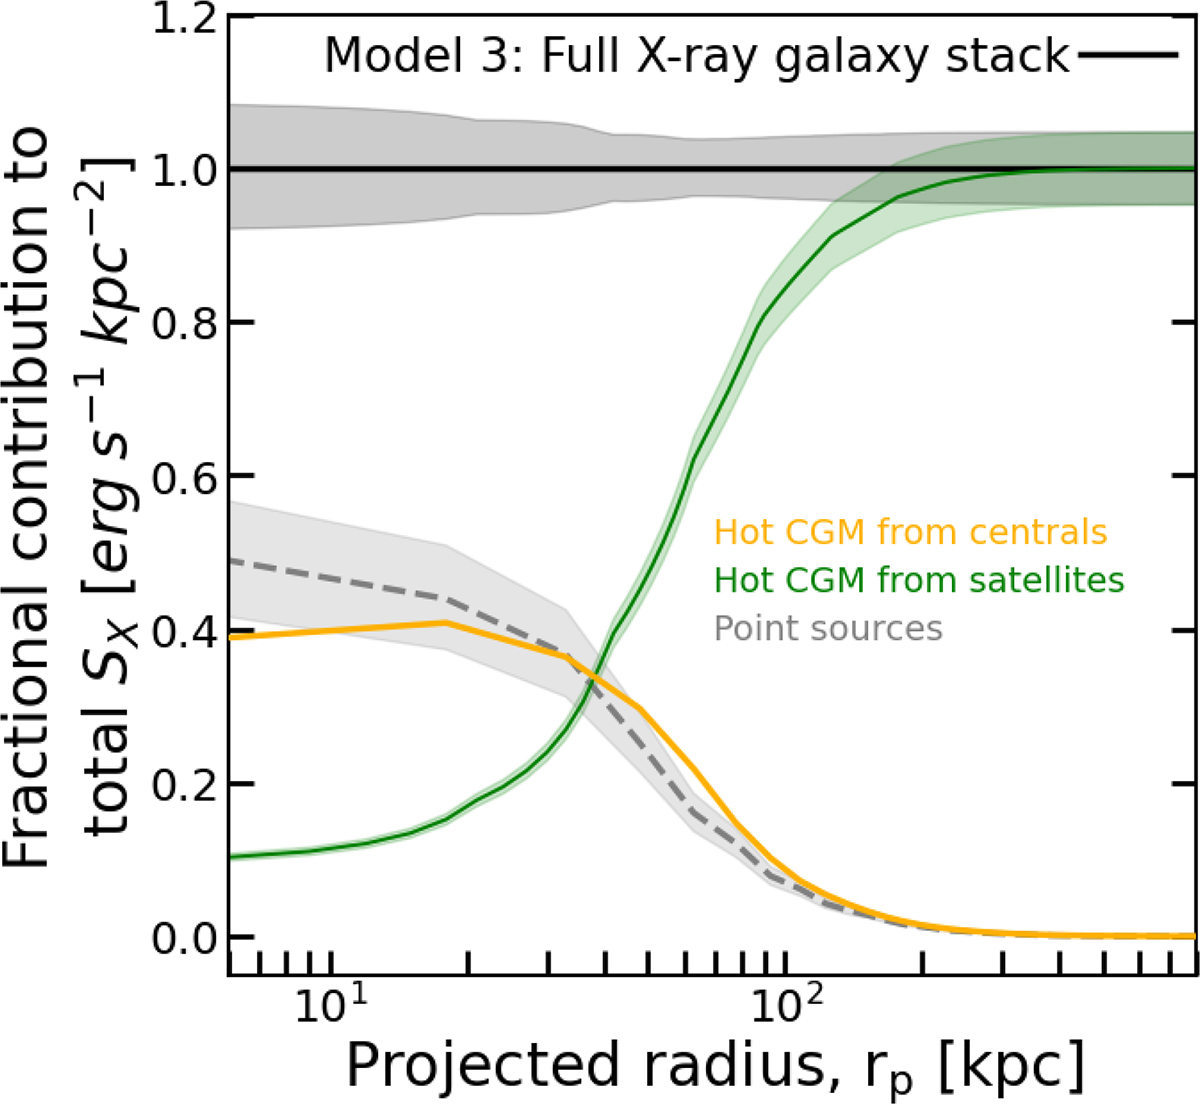
Fig. 5.
Download original image
Fractional contribution of centrals, satellites, and point sources to the total X-ray surface brightness profile of the hot CGM. The yellow line shows the contribution from central galaxies, the green line shows the events around satellites probing the hot gas of their more massive host halos, and the dashed gray line shows the X-ray events from unresolved and resolved point-like sources comprising AGNs and XRBs. The errors on the profiles were obtained from the posterior distributions of the MCMC fitting analysis.
Current usage metrics show cumulative count of Article Views (full-text article views including HTML views, PDF and ePub downloads, according to the available data) and Abstracts Views on Vision4Press platform.
Data correspond to usage on the plateform after 2015. The current usage metrics is available 48-96 hours after online publication and is updated daily on week days.
Initial download of the metrics may take a while.