Fig. 4.
Download original image
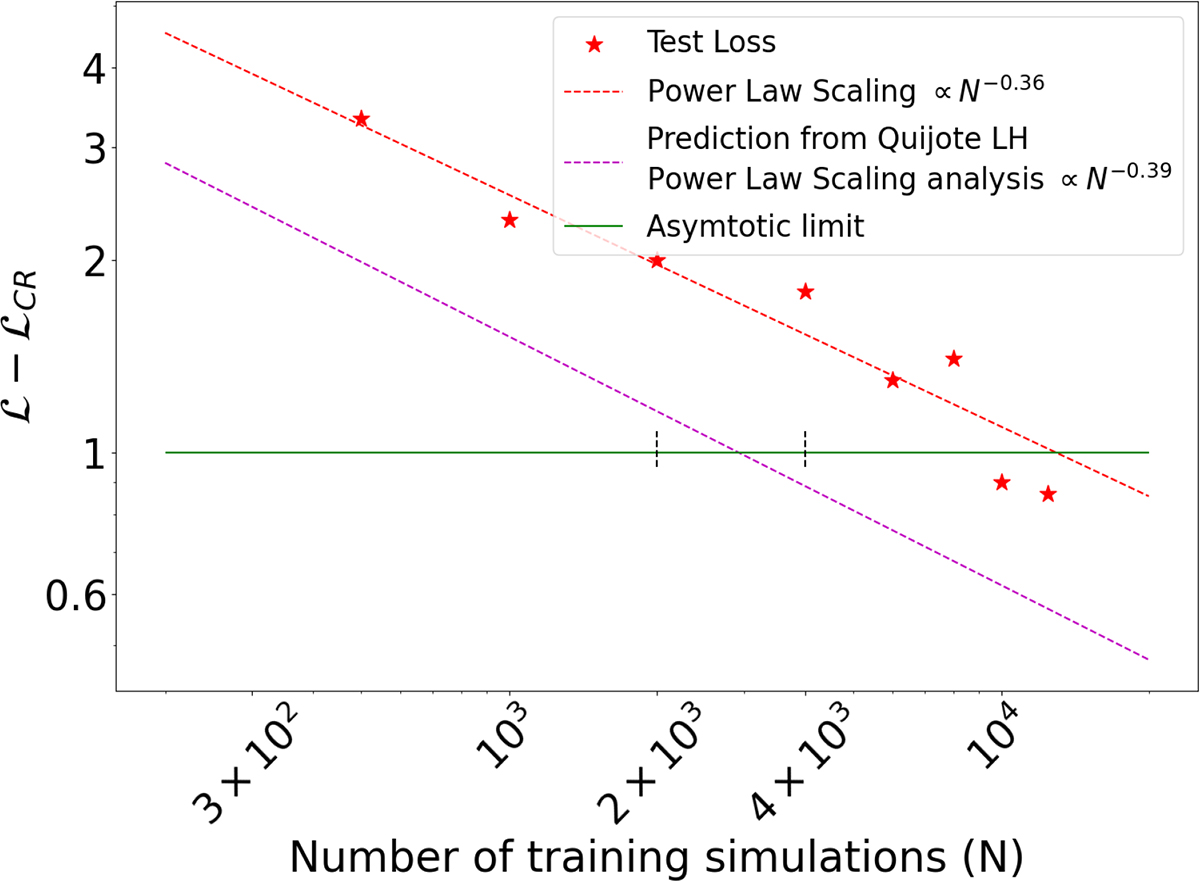
Test loss (Eq. (5)) as a function of the number of BSQ simulations. The loss follows a simple power law scaling law across two orders of magnitude with a power law slope similar to the LH simulations (shown for comparison). The combined test loss for all parameters does not reach the optimal Fisher information computed at the fiducial point. The test loss is computed over the full prior range in parameter space rather than at a single point in the center of the training data. The losses of BSQ simulations are slightly higher than the LH simulations, but Fig. 5 shows that the NN achieves asymptotic optimality at the fiducial point with 4000 simulations.
Current usage metrics show cumulative count of Article Views (full-text article views including HTML views, PDF and ePub downloads, according to the available data) and Abstracts Views on Vision4Press platform.
Data correspond to usage on the plateform after 2015. The current usage metrics is available 48-96 hours after online publication and is updated daily on week days.
Initial download of the metrics may take a while.