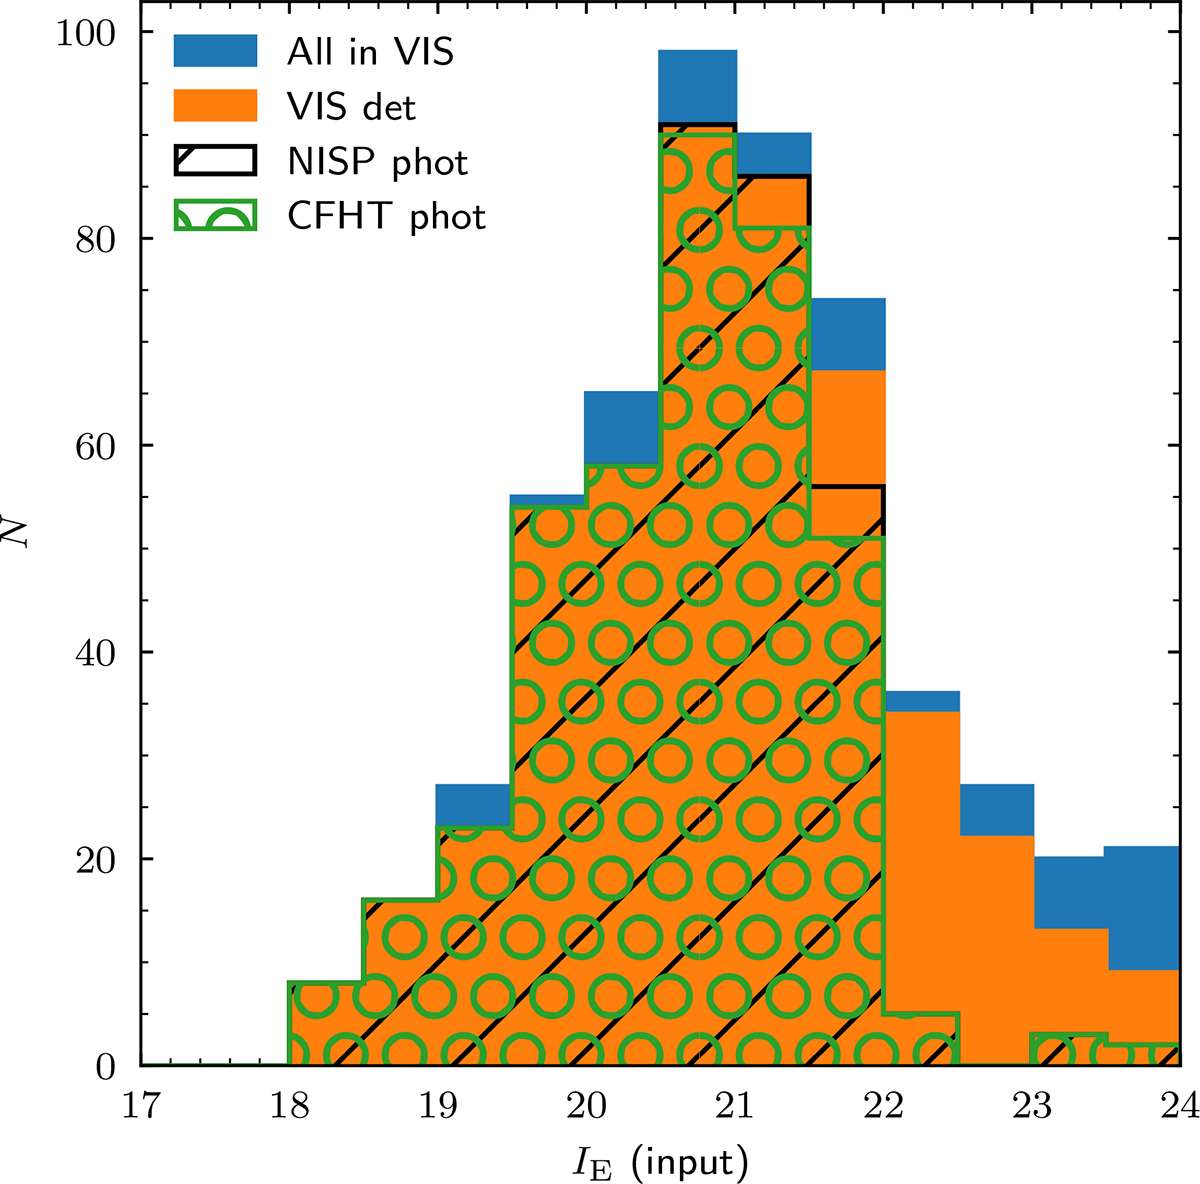
Fig. 4.
Download original image
Luminosity functions for simulated Milky Way GCs added to the Euclid images of IC 342. The distributions of input IE magnitudes are shown for all clusters added within the Euclid footprint (blue), those recovered in the VIS images (orange), and those that also have photometry in the NISP (black hatched) and MegaCam images (green circular-hatched).
Current usage metrics show cumulative count of Article Views (full-text article views including HTML views, PDF and ePub downloads, according to the available data) and Abstracts Views on Vision4Press platform.
Data correspond to usage on the plateform after 2015. The current usage metrics is available 48-96 hours after online publication and is updated daily on week days.
Initial download of the metrics may take a while.