| Issue |
A&A
Volume 703, November 2025
|
|
|---|---|---|
| Article Number | A113 | |
| Number of page(s) | 28 | |
| Section | Extragalactic astronomy | |
| DOI | https://doi.org/10.1051/0004-6361/202554661 | |
| Published online | 20 November 2025 | |
Euclid: Star clusters in IC 342, NGC 2403, and Holmberg II⋆
1
Department of Astrophysics/IMAPP, Radboud University, PO Box 9010 6500 GL, Nijmegen, The Netherlands
2
Institute for Astronomy, University of Edinburgh, Royal Observatory, Blackford Hill, Edinburgh EH9 3HJ, UK
3
INAF-Osservatorio di Astrofisica e Scienza dello Spazio di Bologna, Via Piero Gobetti 93/3, 40129 Bologna, Italy
4
Université Paris-Saclay, Université Paris Cité, CEA, CNRS, AIM, 91191 Gif-sur-Yvette, France
5
INAF-Osservatorio Astrofisico di Arcetri, Largo E. Fermi 5, 50125 Firenze, Italy
6
Université de Strasbourg, CNRS, Observatoire astronomique de Strasbourg, UMR 7550, 67000 Strasbourg, France
7
Instituto de Astrofísica de Canarias, Vía Láctea, 38205 La Laguna, Tenerife, Spain
8
Universidad de La Laguna, Departamento de Astrofísica, 38206 La Laguna, Tenerife, Spain
9
Université Paris-Saclay, CNRS, Institut d’astrophysique spatiale, 91405 Orsay, France
10
ESAC/ESA, Camino Bajo del Castillo, s/n., Urb. Villafranca del Castillo, 28692 Villanueva de la Cañada, Madrid, Spain
11
School of Mathematics and Physics, University of Surrey, Guildford, Surrey GU2 7XH, UK
12
INAF-Osservatorio Astronomico di Brera, Via Brera 28, 20122 Milano, Italy
13
IFPU, Institute for Fundamental Physics of the Universe, via Beirut 2, 34151 Trieste, Italy
14
INAF-Osservatorio Astronomico di Trieste, Via G. B. Tiepolo 11, 34143 Trieste, Italy
15
INFN, Sezione di Trieste, Via Valerio 2, 34127 Trieste TS, Italy
16
SISSA, International School for Advanced Studies, Via Bonomea 265, 34136 Trieste TS, Italy
17
Dipartimento di Fisica e Astronomia, Università di Bologna, Via Gobetti 93/2, 40129 Bologna, Italy
18
INFN-Sezione di Bologna, Viale Berti Pichat 6/2, 40127 Bologna, Italy
19
INAF-Osservatorio Astronomico di Padova, Via dell’Osservatorio 5, 35122 Padova, Italy
20
Dipartimento di Fisica, Università di Genova, Via Dodecaneso 33, 16146 Genova, Italy
21
INFN-Sezione di Genova, Via Dodecaneso 33, 16146 Genova, Italy
22
Department of Physics "E. Pancini", University Federico II, Via Cinthia 6, 80126 Napoli, Italy
23
INAF-Osservatorio Astronomico di Capodimonte, Via Moiariello 16, 80131 Napoli, Italy
24
Instituto de Astrofísica e Ciências do Espaço, Universidade do Porto, CAUP, Rua das Estrelas, PT4150-762 Porto, Portugal
25
Faculdade de Ciências da Universidade do Porto, Rua do Campo de Alegre, 4150-007 Porto, Portugal
26
Dipartimento di Fisica, Università degli Studi di Torino, Via P. Giuria 1, 10125 Torino, Italy
27
INFN-Sezione di Torino, Via P. Giuria 1, 10125 Torino, Italy
28
INAF-Osservatorio Astrofisico di Torino, Via Osservatorio 20, 10025 Pino Torinese (TO), Italy
29
INAF-IASF Milano, Via Alfonso Corti 12, 20133 Milano, Italy
30
Centro de Investigaciones Energéticas, Medioambientales y Tecnológicas (CIEMAT), Avenida Complutense 40, 28040 Madrid, Spain
31
Port d’Informació Científica, Campus UAB, C. Albareda s/n, 08193 Bellaterra (Barcelona), Spain
32
Institute for Theoretical Particle Physics and Cosmology (TTK), RWTH Aachen University, 52056 Aachen, Germany
33
INAF-Osservatorio Astronomico di Roma, Via Frascati 33, 00078 Monteporzio Catone, Italy
34
INFN section of Naples, Via Cinthia 6, 80126 Napoli, Italy
35
Institute for Astronomy, University of Hawaii, 2680 Woodlawn Drive, Honolulu, HI 96822, USA
36
Dipartimento di Fisica e Astronomia “Augusto Righi" – Alma Mater Studiorum Università di Bologna, Viale Berti Pichat 6/2, 40127 Bologna, Italy
37
Jodrell Bank Centre for Astrophysics, Department of Physics and Astronomy, University of Manchester, Oxford Road, Manchester M13 9PL, UK
38
European Space Agency/ESRIN, Largo Galileo Galilei 1, 00044 Frascati, Roma, Italy
39
Université Claude Bernard Lyon 1, CNRS/IN2P3, IP2I Lyon, UMR 5822, Villeurbanne F-69100, France
40
Institut de Ciències del Cosmos (ICCUB), Universitat de Barcelona (IEEC-UB), Martí i Franquès 1, 08028 Barcelona, Spain
41
Institució Catalana de Recerca i Estudis Avançats (ICREA), Passeig de Lluís Companys 23, 08010 Barcelona, Spain
42
UCB Lyon 1, CNRS/IN2P3, IUF, IP2I Lyon, 4 rue Enrico Fermi, 69622 Villeurbanne, France
43
Mullard Space Science Laboratory, University College London, Holmbury St Mary, Dorking, Surrey RH5 6NT, UK
44
Departamento de Física, Faculdade de Ciências, Universidade de Lisboa, Edifício C8, Campo Grande, PT1749-016 Lisboa, Portugal
45
Instituto de Astrofísica e Ciências do Espaço, Faculdade de Ciências, Universidade de Lisboa, Campo Grande, 1749-016 Lisboa, Portugal
46
Department of Astronomy, University of Geneva, ch. d’Ecogia 16, 1290 Versoix, Switzerland
47
INFN-Padova, Via Marzolo 8, 35131 Padova, Italy
48
Aix-Marseille Université, CNRS/IN2P3, CPPM, Marseille, France
49
Max Planck Institute for Extraterrestrial Physics, Giessenbachstr. 1, 85748 Garching, Germany
50
Universitäts-Sternwarte München, Fakultät für Physik, Ludwig-Maximilians-Universität München, Scheinerstrasse 1, 81679 München, Germany
51
INAF-Istituto di Astrofisica e Planetologia Spaziali, via del Fosso del Cavaliere, 100, 00100 Roma, Italy
52
Space Science Data Center, Italian Space Agency, via del Politecnico snc, 00133 Roma, Italy
53
School of Physics, HH Wills Physics Laboratory, University of Bristol, Tyndall Avenue, Bristol BS8 1TL, UK
54
FRACTAL S.L.N.E., calle Tulipán 2, Portal 13 1A, 28231 Las Rozas de Madrid, Spain
55
Institute of Theoretical Astrophysics, University of Oslo, P.O. Box 1029 Blindern, 0315 Oslo, Norway
56
Leiden Observatory, Leiden University, Einsteinweg 55, 2333 CC, Leiden, The Netherlands
57
Jet Propulsion Laboratory, California Institute of Technology, 4800 Oak Grove Drive, Pasadena, CA 91109, USA
58
Felix Hormuth Engineering, Goethestr. 17, 69181 Leimen, Germany
59
Technical University of Denmark, Elektrovej 327, 2800 Kgs. Lyngby, Denmark
60
Cosmic Dawn Center (DAWN), Denmark
61
Max-Planck-Institut für Astronomie, Königstuhl 17, 69117 Heidelberg, Germany
62
NASA Goddard Space Flight Center, Greenbelt, MD 20771, USA
63
Department of Physics and Helsinki Institute of Physics, Gustaf Hällströmin katu 2, 00014 University of Helsinki, Finland
64
Université de Genève, Département de Physique Théorique and Centre for Astroparticle Physics, 24 quai Ernest-Ansermet, CH-1211 Genève 4, Switzerland
65
Department of Physics, P.O. Box 64 00014 University of Helsinki, Finland
66
Helsinki Institute of Physics, Gustaf Hällströmin katu 2, University of Helsinki, Helsinki, Finland
67
Laboratoire d’etude de l’Univers et des phenomenes eXtremes, Observatoire de Paris, Université PSL, Sorbonne Université, CNRS, 92190 Meudon, France
68
SKA Observatory, Jodrell Bank, Lower Withington, Macclesfield, Cheshire SK11 9FT, UK
69
Dipartimento di Fisica “Aldo Pontremoli", Università degli Studi di Milano, Via Celoria 16, 20133 Milano, Italy
70
INFN-Sezione di Milano, Via Celoria 16, 20133 Milano, Italy
71
Universität Bonn, Argelander-Institut für Astronomie, Auf dem Hügel 71, 53121 Bonn, Germany
72
INFN-Sezione di Roma, Piazzale Aldo Moro, 2 – c/o Dipartimento di Fisica, Edificio G. Marconi, 00185 Roma, Italy
73
Aix-Marseille Université, CNRS, CNES, LAM, Marseille, France
74
Dipartimento di Fisica e Astronomia “Augusto Righi" – Alma Mater Studiorum Università di Bologna, via Piero Gobetti 93/2, 40129 Bologna, Italy
75
Department of Physics, Institute for Computational Cosmology, Durham University, South Road, Durham DH1 3LE, UK
76
Université Paris Cité, CNRS, Astroparticule et Cosmologie, 75013 Paris, France
77
CNRS-UCB International Research Laboratory, Centre Pierre Binetruy, IRL2007, CPB-IN2P3 Berkeley, USA
78
Institut d’Astrophysique de Paris, 98bis Boulevard Arago, 75014 Paris, France
79
Institut d’Astrophysique de Paris, UMR 7095, CNRS, and Sorbonne Université, 98 bis boulevard Arago, 75014 Paris, France
80
Institute of Physics, Laboratory of Astrophysics, Ecole Polytechnique Fédérale de Lausanne (EPFL), Observatoire de Sauverny, 1290 Versoix, Switzerland
81
Aurora Technology for European Space Agency (ESA), Camino bajo del Castillo, s/n, Urbanizacion Villafranca del Castillo, Villanueva de la Cañada, 28692 Madrid, Spain
82
Institut de Física d’Altes Energies (IFAE), The Barcelona Institute of Science and Technology, Campus UAB, 08193 Bellaterra (Barcelona), Spain
83
European Space Agency/ESTEC, Keplerlaan 1, 2201 AZ, Noordwijk, The Netherlands
84
DARK, Niels Bohr Institute, University of Copenhagen, Jagtvej 155, 2200 Copenhagen, Denmark
85
Waterloo Centre for Astrophysics, University of Waterloo, Waterloo, Ontario N2L 3G1, Canada
86
Department of Physics and Astronomy, University of Waterloo, Waterloo, Ontario N2L 3G1, Canada
87
Perimeter Institute for Theoretical Physics, Waterloo, Ontario N2L 2Y5, Canada
88
Centre National d’Etudes Spatiales – Centre spatial de Toulouse, 18 avenue Edouard Belin, 31401 Toulouse Cedex 9, France
89
Institute of Space Science, Str. Atomistilor, nr. 409 Măgurele, Ilfov 077125, Romania
90
Dipartimento di Fisica e Astronomia “G. Galilei", Università di Padova, Via Marzolo 8, 35131 Padova, Italy
91
Institut für Theoretische Physik, University of Heidelberg, Philosophenweg 16, 69120 Heidelberg, Germany
92
Institut de Recherche en Astrophysique et Planétologie (IRAP), Université de Toulouse, CNRS, UPS, CNES, 14 Av. Edouard Belin, 31400 Toulouse, France
93
Université St Joseph; Faculty of Sciences, Beirut, Lebanon
94
Departamento de Física, FCFM, Universidad de Chile, Blanco Encalada 2008, Santiago, Chile
95
Institut d’Estudis Espacials de Catalunya (IEEC), Edifici RDIT, Campus UPC, 08860 Castelldefels, Barcelona, Spain
96
Satlantis, University Science Park, Sede Bld 48940, Leioa-Bilbao, Spain
97
Institute of Space Sciences (ICE, CSIC), Campus UAB, Carrer de Can Magrans, s/n, 08193 Barcelona, Spain
98
Centre for Electronic Imaging, Open University, Walton Hall, Milton Keynes MK7 6AA, UK
99
Instituto de Astrofísica e Ciências do Espaço, Faculdade de Ciências, Universidade de Lisboa, Tapada da Ajuda, 1349-018 Lisboa, Portugal
100
Universidad Politécnica de Cartagena, Departamento de Electrónica y Tecnología de Computadoras, Plaza del Hospital 1, 30202 Cartagena, Spain
101
Centre for Information Technology, University of Groningen, P.O. Box 11044 9700 CA, Groningen, The Netherlands
102
INFN-Bologna, Via Irnerio 46, 40126 Bologna, Italy
103
Kapteyn Astronomical Institute, University of Groningen, PO Box 800 9700 AV, Groningen, The Netherlands
104
Infrared Processing and Analysis Center, California Institute of Technology, Pasadena, CA 91125, USA
105
ICL, Junia, Université Catholique de Lille, LITL, 59000 Lille, France
⋆⋆ Corresponding author: This email address is being protected from spambots. You need JavaScript enabled to view it.
Received:
20
March
2025
Accepted:
28
July
2025
Abstract
We examine the star cluster populations in the three nearby (3.20–3.45 Mpc) galaxies IC 342, NGC 2403, and Holmberg II, observed as part of the Euclid Early Release Observations programme. Our main focus in this paper is old globular clusters (GCs), for which the wide field of view and excellent image quality of Euclid offer substantial advantages over previous works. With respect to IC 342, in particular, this is the first study of stellar clusters that goes beyond its nuclear cluster. After a selection process based on size and magnitude criteria, followed by visual inspection, we identified 111 old (≳1 Gyr) GC candidates in IC 342, 49 in NGC 2403 (of which 15 were previously known), along with 7 in Holmberg II. In addition, a number of younger and/or intermediate-age candidates were identified. The colour distributions of GC candidates in the two larger galaxies show hints of bimodality, with peaks at (IE−{HE)0 = 0.36 and 0.79 in both IC 342 and NGC 2403, corresponding to metallicities of [Fe/H] ≈ −1.5 and [Fe/H] ≈ −0.5. These results are similar to those reported for the metal-poor and metal-rich GC subpopulations in the Milky Way. The luminosity functions of our GC candidates exhibit an excess of relatively faint objects, relative to a canonical, approximately Gaussian GC luminosity function (GCLF). Although some contamination from background galaxies and younger clusters might be present in our GC samples, we argue that the excess could be at least partially real. In particular, we find this could be the case for IC 342, where the excess objects could be similar to those previously identified, for example, in M101 and NGC 6946. The specific frequency of old GCs in IC 342, as determined on the basis of the brighter half of the GCLF, appears to be unusually low with SN ≈ 0.2–0.3. The combined luminosity function of young and intermediate-age clusters in all three galaxies is consistent with a power-law distribution of dN/dL ∝ L−2.3 ± 0.1. The total numbers of young clusters brighter than M(IE) = −8 in NGC 2403 and Holmberg II are comparable with those found in their Local Group counterparts, namely, M33 and the Small Magellanic Cloud, respectively.
Key words: galaxies: individual: IC 342 / galaxies: individual: NGC2403 / galaxies: individual: Holmberg II / galaxies: spiral / galaxies: star clusters: general
This paper is published on behalf of the Euclid Consortium.
© The Authors 2025
 Open Access article, published by EDP Sciences, under the terms of the Creative Commons Attribution License (https://creativecommons.org/licenses/by/4.0), which permits unrestricted use, distribution, and reproduction in any medium, provided the original work is properly cited.
This article is published in open access under the Subscribe to Open model. This email address is being protected from spambots. You need JavaScript enabled to view it. to support open access publication.
1. Introduction
As part of the Euclid Early Release Observations (Euclid Early Release Observations 2024; Cuillandre et al. 2025, hereafter C25), the three galaxies IC 342, NGC 2403, and Holmberg II were observed in the context of the Nearby Galaxies Showcase programme (Hunt et al. 2025; hereafter H25). In terms of their total luminosities and overall morphologies, these galaxies are comparable to the Milky Way or M31, as well as M33, and the Small Magellanic Cloud, respectively. They are located at distances of 3.20–3.45 Mpc, which is close enough for the brightest red giants to be resolved in the Euclid images, and for stellar clusters to appear noticeably more extended than point sources. In the present paper, we follow up on the initial exploratory work on globular clusters (GCs) presented in H25 with a more detailed analysis of the star cluster populations in the three galaxies. An analysis of the star cluster populations in the Local Group galaxies IC 10 and NGC 6822, which were also included in the Showcase programme, will be published as a separate paper (Howell et al. 2025).
A comparison of the star cluster populations of Local Group and other nearby galaxies reveals a considerable degree of diversity. In particular, the distinction between ancient (globular) clusters (GCs), typically associated with the spheroidal components of their parent galaxies, and younger (open) star clusters in star-forming discs is not always as clear as it might appear to be in the Milky Way. Over the past decade, evidence has emerged that differences in the mass function of young star clusters are correlated with the star formation rate and gas surface density of the parent galaxies (Larsen 2009; Johnson et al. 2017; Wainer et al. 2022). Thus, the more massive clusters form preferentially in environments with high star formation rates. This suggests that the ancient GCs, which must have been born with masses greater than 105 M⊙ to survive to the present epoch, can trace episodes of intense star formation in the past histories of their parent galaxies, whether these took place in situ or in smaller galaxies that were subsequently accreted.
Theoretical efforts to model the characteristics of GC populations, based upon the premise that their initial properties can be determined by applying knowledge obtained from studies of young cluster populations in various environments, have been met with considerable success (Choksi et al. 2018; Pfeffer et al. 2023; Reina-Campos & Kruijssen 2017; Reina-Campos et al. 2022). A key prediction from such modelling is that the characteristics of GC populations, such as their age, metallicity, and phase-space distributions, will depend on the individual hierarchical assembly histories of galaxies (Pfeffer et al. 2020; Trujillo-Gomez et al. 2023).
There is ample empirical evidence to support the hierarchical assembly paradigm in both the Milky Way and M31 GC systems. Mackey & Gilmore (2004) estimated that about 40 of the Milky Way halo GCs have been accreted from approximately seven dwarf galaxies. Subsequent works have substantiated and refined these results, suggesting that about half of the Galactic GCs might have an accretion-based origin. These works have even associated GCs with specific dwarf galaxies and streams, and have provided significant insight into the assembly history of the Milky Way (Forbes & Bridges 2010; Massari et al. 2019; Forbes 2020; Kruijssen et al. 2020; Callingham et al. 2022; Limberg et al. 2022; Belokurov & Kravtsov 2024). The high fraction of accreted GCs inferred from observations is in agreement with expectations from theoretical work (Qu et al. 2017; Davison et al. 2020; Keller et al. 2020). Likewise, about half of the GCs in the outer halo of M31 appear to be associated with the halo sub-structure that is clearly evident from observations of the field stars (Mackey et al. 2010, 2019b,a). The M31 GC system is significantly more populous than that of the Milky Way: the Harris (1996) (2010 edition) catalogue lists 157 GCs in the Milky Way, while M31 probably has at least three times as many (Harris et al. 2013; Huxor et al. 2014; Larsen 2016). A similar analysis is more challenging for M33, owing to its sparser GC system. Harris et al. (2013) listed a total of about 50 ± 20 GCs for M33, but the number of objects that have been robustly confirmed individually as ancient GCs, based either on resolved imaging (Sarajedini et al. 1998; Chandar et al. 1999; Sarajedini et al. 2000; Huxor et al. 2009; Cockcroft et al. 2011) or spectroscopy (Beasley et al. 2015; Larsen et al. 2022), is much smaller.
Beyond the Local Group, a vast collection of literature on extragalactic GC systems has accumulated over the past several decades. The GC systems of spiral galaxies are particularly difficult to identify and characterise, as they are generally poorer than those of early-type galaxies and harder to pick out among a variety of potential contaminants in the discs of spirals. As in some Local Group galaxies, the distinction between GCs and young massive clusters is frequently blurred, and young clusters with masses in the range 105–106 M⊙ have been found in a number of actively star-forming galaxies, such as M51, M83, and NGC 6946 (Larsen 1999; Larsen et al. 2001a; Haas et al. 2008; Chandar et al. 2016), as well as starburst dwarf galaxies and interacting and merging galaxies (Portegies Zwart et al. 2010; Whitmore et al. 2010; Adamo et al. 2020a,b). Generally speaking, younger clusters are expected to be bluer than their older counterparts (i.e. GCs), but several factors come together to make the distinction far from straightforward in practice. These factors include the age-metallicity degeneracy, whereby old, metal-poor stellar populations have colours similar to those of younger, more metal-rich ones (Worthey 1994). Surveys such as PHANGS have demonstrated the power of high-quality multi-passband imaging for identification and rough age-dating of clusters, especially when UV imaging is included (Floyd et al. 2024; Maschmann et al. 2024). However, even with multi-colour photometry, broad-band colours remain much more sensitive to metallicity than to age for ages greater than about a Gyr, making accurate age-dating challenging (Chies-Santos et al. 2011; Powalka et al. 2017). Additional complications come from uncertainties in the reddening, random fluctuations in the colours due to stochastic sampling of the stellar masses (Fouesneau & Lançon 2010; Popescu & Hanson 2010; de Meulenaer et al. 2014), and the overall difficulties associated with obtaining accurate photometry for objects superimposed on a highly irregular background.
The richness of a GC system is usually quantified by the GC specific frequency, SN = NGC 100.4(MV + 15) (Harris & van den Bergh 1981), for a galaxy with NGC GCs and an integrated absolute visual magnitude MV. The Milky Way exhibits SN = 0.48, while M31 exhibits SN = 0.86, which are fairly typical values for spiral galaxies (assuming MV = −21.3 for the Milky Way and −21.8 for M31, as listed by Harris et al. 2013). The Sombrero galaxy, M104/NGC 4594 (type S0/Sa), has a rich GC system that can be fairly easily identified even in ground-based data (Harris et al. 1984; Bridges & Hanes 1992), with the most recent study estimating a total of 1610 ± 30 GCs and a corresponding specific frequency of SN = 1.8 ± 0.1 (Kang et al. 2022). Another well-studied system is the nearby Sb-type spiral M81 (e.g. Chies-Santos et al. 2022; Pan et al. 2022). Despite the challenges associated with identifying individual GCs, the estimate of the total number of GCs in M81 has remained relatively stable over time, with Perelmuter et al. (1995) quoting an estimated total of NGC = 210 ± 30 and Nantais et al. (2011) finding 220–230 GCs, which yields SN ≈ 1.1–1.2.
The excellent image quality over a wide field-of-view offered by Euclid (Euclid Collaboration: Mellier et al. 2025) holds greats promise for studying the outskirts of nearby galaxies, including their GC systems. It is in these regions that the signatures of hierarchical assembly histories are expected to be most apparent and identifications of GC candidates for further spectroscopic follow-up studies is therefore of considerable interest. Our main focus in this paper is on the old GC populations in and around the three galaxies, IC 342, NGC 2403, and Holmberg II. Hence, our lists of cluster candidates are built primarily with GCs in mind, although they also contain plenty of younger objects. Compared with previously published studies of GC systems based on the ERO data, such as Fornax (Saifollahi et al. 2025), Dorado (Urbano et al. 2025), and Perseus (Kluge et al. 2025), the Showcase galaxies are much closer. GCs are, therefore, expected to be better resolved, but also spread out over a larger area of the sky. Therefore, besides identifying and characterising the GC systems of these three nearby galaxies and comparing with those of the Local Group counterparts, another aim of this paper is to gain a better understanding of how best to capitalise on the unique characteristics of Euclid in this regime. We leave aside the question of the exact relation between ‘ancient’ GCs and the younger clusters observed in star-forming galaxies, and do not intend to discuss whether a physically meaningful distinction can even be made between these classes of objects. We loosely (and perhaps not always entirely consistently) use the term GC to refer to objects with relatively red integrated colours, presumably indicating ‘old’ ages (∼ Gyr). A detailed description of our identification and classification criteria is given below (Sect. 4).
2. Data
The three galaxies were all observed with the same standard Reference Observing Sequence (ROS) used for the main Euclid Wide Survey (Euclid Collaboration: Scaramella et al. 2022), with four dithered subexposures yielding a total exposure time of 4 × 566 s in the IE filter of the VIS instrument (Euclid Collaboration: Cropper et al. 2025) and 4 × 87.2 s in each of the YE, JE, and HE filters of the NISP instrument (Euclid Collaboration: Jahnke et al. 2025). The pixel scale of the VIS instrument,  pixel−1 (Euclid Collaboration: Cropper et al. 2025), corresponds to a linear scale of 1.6–1.7 pc at distances of 3.20–3.45 Mpc, so that for a typical point-spread function (PSF) full width at half maximum (FWHM) of about 1.6 pixel, the light profiles of star clusters with half-light radii of several pc are expected to be significantly broader than those of individual stars. The field of view is about
  for both instruments, or about 39 kpc × 45 kpc at 3.2 Mpc. As described in H25 (where colour composite images can be found), the ERO data were processed independently of the standard Euclid science ground segment pipelines, using a custom procedure described in detail in C25.
For NGC 2403 and IC 342, the Euclid imaging data were supplemented with archival ground-based observations obtained with MegaCam on the Canada-France-Hawaii Telescope (CFHT). The MegaCam images cover a  field of view centred on each galaxy in the filters u, g, and r, as well as Hα for IC 342. The observations of NGC 2403 were made on 30 January 2012, while those of IC 342 were made between 12 January and 11 February 2021. The exposure times were 5 × 60 s (g, r) and 5 × 240 s (u) for NGC 2403, and 7 × 120 s (g), 21 × 120 s (r), 7 × 240 s (u), and 14 × 360 s (Hα) for IC 342. For each filter and galaxy, the MegaCam mosaics of 40 individual 2048 × 4612 pixel CCDs were combined and co-added to a single image with a pixel scale of
  since the data were obtained in a FWHM seeing of typically
  for a diffuse emission motivated programme (down from the native camera sampling of
  ). For the photometric calibration of the MegaCam data we used the zero-points specified in the image headers as derived by the CFHT Elixir pipeline (Magnier & Cuillandre 2004).
For Holmberg II, we supplemented the Euclid observations with deep imaging in the g and r bands from the Large Binocular Telescope (LBT). These images were acquired as part of the Smallest Scale of Hierarchy Survey (Annibali et al. 2020), using the Large Binocular Camera (LBC) which has a field of view of about 23′×23′. The images were acquired in binocular mode for a total 1 h exposure time in each band, organised into 240 s dithered exposures. During observations, the seeing was  . Image reduction and creation of the final g and r stacked mosaics were performed using a specific pipeline developed at INAF-OAR, as described in detail in Annibali et al. (2020). The photometric calibration is based on the PanSTARRS1 (Chambers et al. 2016; Flewelling et al. 2020) photometric catalogue, after the PS1 photometry was transformed into the SDSS photometric system using the equations provided by Tonry et al. (2012). We note that the Euclid and MegaCam/LBT photometry used in this paper is calibrated to the AB system, while literature B and V magnitudes are generally (approximately) Vega-based.
3. Overview of the three galaxies
Basic properties of the galaxies are listed in Table 1. We assume the same distances and foreground extinctions as in H25, while the integrated photometry is from the RC3 catalogue (de Vaucouleurs et al. 1991) as provided through the NASA/IPAC Extragalactic Database (NED). The RC3 lists no V magnitude for IC 342, but we have assumed a colour of (B − V)0 = 0.7, which is intermediate between those of (B − V)0 = 0.51 for M33 and (B − V)0 = 0.87 for M31. For Holmberg II, we note that Bernard et al. (2012) find a somewhat fainter integrated magnitude, MV = −16.3. Here and elsewhere, we follow the common convention of denoting reddening-corrected colours by the subscript ‘0’. The star formation rates, SFRFIR, were computed from far-infrared (FIR) magnitudes (mFIR) and distances, D, using Eq. (6) from Larsen & Richtler (2000). The underlying calibration of the SFR in terms of FIR luminosity (Buat & Xu 1996) claims an uncertainty of about a factor of two for galaxies with a morphological type of Sb or later, although a comparison with the SFR derived from resolved photometry for Holmberg II (see below) suggests a substantially larger uncertainty. Therefore, the SFRs in Table 1 should only be taken as indicative.
Galaxy properties.
We corrected the photometry for a single value of the foreground extinction, assumed to be uniform across each field. The AV values were converted to extinctions in each of the Euclid filters, assuming a spectral template with Teff = 4500 K, log g = 2, and [Fe/H] = −1 (as an approximation to the spectrum of an old, moderately metal-poor GC), with the G23 extinction curve from Gordon et al. (2023). The conversions are: A(IE)/AV = 0.69, A(YE)/AV = 0.35, A(JE)/AV = 0.23, and A(HE)/AV = 0.15. For the MegaCam filters the corresponding conversions are Au/AV = 1.50, Ag/AV = 1.14, and Ar/AV = 0.81. For the LBT photometry we used the Galactic foreground extinctions for SDSS g and r from Schlafly & Finkbeiner (2011), available through the NED. Although the extinction correction will depend somewhat on the spectral energy distribution (SED) of each source, especially for the very broad IE filter, we assumed a single correction for all sources.
For a standard, approximately Gaussian GC luminosity function (in magnitude units), the turn-over is expected at MTO(IE) ≈ −8 (Euclid Collaboration: Voggel et al. 2025). For the distances and extinctions of NGC 2403 and Holmberg II this implies an apparent magnitude of mTO(IE) ≈ 19.7, while the higher foreground extinction (and slightly greater distance) of IC 342 places the expected turn-over at mTO(IE) ≈ 20.9.
NGC 2403 is an outlying member of the M81 group (Tammann & Sandage 1968). Its MB is about 0.3 mag brighter than that of M33 and (similarly to M33), it is a late-type spiral with no central bulge. Deep imaging of its outer parts has revealed an extended stellar component that can be traced to a distance of 40 kpc from the centre of the galaxy (Barker et al. 2012) and the galaxy also has a relatively undisturbed, symmetric, and warp-free HI disc (de Blok et al. 2008). This points to NGC 2403 having evolved in relative isolation until the present time and now being on its first approach towards the M81 group (Williams et al. 2013), although there is evidence of an interaction with the dwarf galaxy DDO 44 (Carlin et al. 2019; Veronese et al. 2023). The SFRFIR is lower by about a factor of two than the SFR of ∼0.74 M⊙ yr−1 of M33 (Lazzarini et al. 2022). However, Williams et al. (2013) found a SFR of 0.7 M⊙ yr−1 for NGC 2403. Hence, within the margins of uncertainty, the two galaxies could be considered to have similar SFRs. Prior to the Euclid ERO observations, a number of studies had identified GC candidates in NGC 2403 (Tammann & Sandage 1968; Battistini et al. 1984; Drissen et al. 1999; Davidge 2007; Forbes et al. 2022) and seven old GCs had been confirmed spectroscopically, with eight new candidates identified in H25. Based on the halo mass versus GC number relation of Burkert & Forbes (2020), Forbes et al. (2022) predicted a total population of 40–50 GCs, suggesting that a significant number of GCs might still be awaiting discovery.
IC 342 is one of the closest large spirals outside the Local Group, but its low Galactic latitude ( ) and considerable foreground extinction make it a challenging target for studies of stellar clusters (and old GCs, especially). With MV ≈ −21.3, its luminosity is comparable to that of the Milky Way and somewhat lower than that of M31 (see the introduction to this paper). The SFRFIR is similar to the current SFR of the Milky Way (2.0 ± 0.7 M⊙ yr−1; Elia et al. 2022) and several times higher than that of M31 (∼0.3–0.4 M⊙ yr−1; Tabatabaei & Berkhuijsen 2010). To our knowledge, there are no previous studies of GCs or other star clusters in IC 342, other than the massive (M ∼ 6 × 10⁶ M⊙) nuclear star cluster (Böker et al. 1999; Schinnerer et al. 2003). By comparison with the Milky Way and M31, we might expect to find 150–500 GCs in IC 342.
Finally, Holmberg II (UGC 4305 = DDO 50) has a luminosity that is similar to that of the SMC and we might expect to find a few several-Gyr old GCs in Holmberg II. Compared to SFRFIR, estimates from resolved colour-magnitude diagrams (CMDs) give a higher SFR of ∼0.06 M⊙ yr−1 averaged over the past 1 Gyr (Weisz et al. 2008), but still slightly lower than the mean SFR of about 0.1 M⊙ yr−1 over the past 2–3 Gyr derived for the SMC with similar methods (Harris & Zaritsky 2004). Alternatively, we can compare the absolute FIR magnitudes of the SMC (MFIR = −15.50) and Holmberg II (MFIR = −15.13) directly; the difference again suggests a slightly lower SFR for Holmberg II. The star cluster population in Holmberg II was included in the HST-based study by Billett et al. (2002) and the galaxy was also part of the ANGST (Cook et al. 2012) and LEGUS (Cook et al. 2019) surveys.
4. Analysis
4.1. Identification of cluster candidates
To search for star clusters, we first generated lists of sources in the VIS images using SExtractor (Bertin & Arnouts 1996). We determined a source to be detected based on at least six connected pixels (DETECT_MINAREA = 6), each with a signal exceeding the mean background level by eight standard deviations of the background noise (DETECT_THRESH = 8). An area of six pixels corresponds to a radius of 1.4 pixels or ≈2.3 pc at the distances of our galaxies; therefore, we expect the light from a typical star cluster with a half-light radius of several pc to extend over a significantly larger area than six pixels, so this requirement would not be expected to significantly bias the detection against even fairly compact clusters. This expectation is borne out by the completeness tests described below (Sect. 4.3).
Next, we converted the coordinates of sources detected in the VIS images to the NISP and MegaCam (LBT for Holmberg II) frames, using the World Coordinate System information in the image headers. For the IC 342 and Holmberg II images, no significant systematic offsets were found between the coordinate systems of the Euclid and ground-based observations, whereas corrections of  in RA and
  in Dec were applied to the MegaCam solution for NGC 2403. We then used the IRAF version of DAOPHOT (Stetson 1987) to obtain aperture photometry on all images, using an aperture radius of 1″ (10 pixels for the VIS images, 3.3 pixels for NISP, 2 pixels for MegaCam, and 4.4 pixels for LBT). The transformed coordinates from the VIS images were used directly, with no re-centring. The adopted aperture radius was chosen as a compromise suitable for both the high-resolution Euclid images and the ground-based data, while at the same time being large enough to avoid large systematic uncertainties on the total magnitudes of the clusters. For a King (1962) profile with a half-light radius of 3 pc and distances of 3.20–3.45 Mpc, the adopted 1″ aperture encloses 96–97% of the total light, although the PSF will still scatter a larger fraction of the total light beyond this radius, even for a point source. For the Euclid images aperture corrections of −0.072 mag (IE) and −0.135 mag (HE) were adopted from C25, as in H25. For the ground-based images, aperture corrections from the r = 1″ apertures were determined by measuring the differences between the magnitudes measured in those apertures and larger apertures for about 50 isolated stars in each frame, located outside the main bodies of the galaxies. The curves of growth were found to flatten beyond r = 5″; hence, those apertures were used as a reference. For the IC 342 observations, the aperture corrections were determined to be −0.404 mag, −0.378 mag, and −0.393 mag in the u, g, and r filters. For NGC 2403, the corresponding corrections were −0.679 mag, −0.564 mag, and −0.323 mag and for Holmberg II, the corrections were −0.153 mag (g) and −0.144 mag (r). The differences between the different images mainly reflect differences in the seeing. We assumed that these aperture corrections, determined for point sources, were also adequate for star clusters.
The initial SExtractor runs detected more than 100 000 sources in each field, of which only a very small fraction are star clusters. Hence, an additional selection based on the sizes and magnitudes of the sources was applied, followed by a visual inspection of the remaining candidates. We used the ISHAPE code (Larsen 1999, 2014) to measure PSF-corrected sizes for all sources brighter than IE = 22 in each image. At this magnitude, the photometric uncertainties for the VIS images are generally less than 0.01 mag, corresponding to a S/N > 100, ensuring accurate size measurements (Larsen 1999). A PSF was first constructed for each image from about 100 individual, isolated stars, using the PSF task in DAOPHOT. ISHAPE then measured the intrinsic sizes of the sources by convolving a chosen analytic model profile with the PSF and adjusting the FWHM of the model until the best match was obtained. We assumed King (1962) profiles with a concentration index c = rt/rc = 30 for tidal and core radii, rt and rc, as a reasonable approximation to the luminosity profiles of old GCs. For these models, the conversion between the FWHM and half-light radius, rh, is given by rh = 1.48 FWHM (Larsen 2014). We allowed ISHAPE to fit for both the major and minor axes of the models but used the sizes measured along the major axis. In principle, the ratio of the minor to the major axis of the model fit might be used as an additional selection criterion. However, while most Milky Way GCs appear fairly round in projection, star clusters in some galaxies, such as the LMC and NGC 6822, have a broader distribution of axis ratios, reaching values as low as ∼0.6 (Goodwin 1997; Huxor et al. 2013; Larsen 2001). Therefore, to avoid introducing a bias against unusually elliptical objects, we have chosen not to use the axis ratio as a selection criterion here. A master catalogue containing the Euclid VIS and NISP photometry, the ISHAPE size measurements, and the MegaCam/LBT ground-based photometry was produced for each field.
Cluster candidates were selected from the master catalogues by applying the same size cut as in H25: FWHM > 0.5 pixels for 19 < IE < 21.5 and FWHM > 0.5−(IE−19)/10 pixels for IE < 19. The size cut is indicated by the red line in Fig. 1, which shows the ISHAPE PSF-corrected FWHM values as a function of the IE magnitude for sources in the NGC 2403 master catalogue. The previously known GCs are shown as filled red circles and the candidates from H25 are shown with open red circles. The figure also shows data for Milky Way GCs (Harris 1996), scaled to a distance of 3.2 Mpc and assuming a constant V−IE = 0.5. For the Milky Way GCs, the same conversion between FWHM and rh given above has been assumed, although this depends somewhat on the concentration parameter and not all Milky Way GCs have exactly the same c value. Nevertheless, it is clear that the vast majority of the Milky Way GCs would fall above the adopted size cut. A sequence of unresolved sources (stars) is visible at FWHM = 0 pixels for magnitudes IE > 18. At brighter magnitudes, point-like sources are saturated in the VIS images and ISHAPE thus tends to measure larger sizes, while more extended sources can still avoid saturation. The limit at FWHM = 0.5 pixels corresponds to about 0.75 pc at a distance of 3.2 Mpc, or a half-light radius of about 1.1 pc for the assumed King c = 30 model profiles.
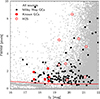 |
Fig. 1. PSF-corrected FWHM size as a function of IE magnitude for sources in the NGC 2403 field. Previously known GCs are shown with red filled circles while the new candidates identified in H25 are shown with open circles. Data for Milky Way GCs are also included, scaled to the distance of NGC 2403 (black filled circles). The red line indicates our size cut for the selection of cluster candidates. |
Accounting for the assumed distances and foreground extinctions, the apparent IE = 21.5 magnitude limit translates to absolute magnitudes of M(IE) = − 7.24, −6.10, and −6.17 for IC 342, NGC 2403, and Holmberg II, respectively. Using PARSEC simple stellar population models (Bressan et al. 2012) for an age of 10 Gyr, [Fe/H] = −1, and assuming a Kroupa (2001) IMF, these magnitudes correspond to (initial) masses of about 1.9 × 10⁵ M⊙, 6.7 × 10⁴ M⊙, and 7.2 × 10⁴ M⊙, respectively, although the present-day masses corrected for stellar evolution will be about a factor of two lower. We also note that dynamical evolution was not considered in this estimate.
While the size cut eliminates most foreground stars, the remaining sources still include many non-clusters. Outside the main bodies of the galaxies, these are mainly background galaxies, but SExtractor also detects numerous sources in crowded regions of the disc and spiral arms, many of which remain in the candidate catalogue also after application of the size cut. It is difficult to ascertain the exact nature of many of these sources. Some are clearly regions of ongoing or very recent star formation, associated with nebulosity, while others could be young star clusters or OB associations, or simply asterisms (chance alignments of a few relatively bright stars) or regions of higher-than-average surface brightness that happen to be picked up by SExtractor. Background galaxies tend to be redder than GCs, but with some overlap, so that a colour cut can potentially help reduce the contamination. Nonetheless, a visual inspection was still found to be a necessary further step.
4.2. Artificial cluster tests: Expected appearance of GCs
To assess how GCs are expected to look in the Euclid images, we added artificial clusters to the VIS images of NGC 2403 and IC 342 at several different locations within the two galaxies. The artificial clusters were generated by sampling stellar masses at random from a Kroupa (2001) IMF and distributing them spatially according to a probability distribution defined by a King (1962) profile. EuclidIE magnitudes were then assigned to each star by interpolating in a PARSEC isochrone (Bressan et al. 2012; Tang et al. 2014; Chen et al. 2015) with [Fe/H] = −1.0 and an age of t = 10 Gyr. The absolute magnitudes from the isochrone were converted to apparent magnitudes in the Euclid images by adding the distance modulus and A(IE) value appropriate for each galaxy. The clusters were then simulated by adding these member stars to the VIS images with the MKSYNTH task in the BAOLAB package (Larsen 2014), using the same PSFs as for the ISHAPE size measurements. Simulated clusters with masses of 105 M⊙, 3 × 10⁵ M⊙, and 106 M⊙ and a half-light radius of 3 pc were added next to a known cluster (or cluster candidate), separated by 7″.
Figure 2 shows artificial clusters in NGC 2403 added next to the known GCs D6 (top; at a projected separation of  from the centre of NGC 2403), JC15 (middle; at
  ), and a new candidate nearer the centre (bottom; ESCC-NGC2403-118), at
  (we adopted the naming convention ESCC-Galaxy-ID, for Euclid Star Cluster Candidate, for the new star cluster candidates). The three cases, which are all displayed with the same contrast settings, illustrate a range of crowding conditions encountered within the images. Near D6, the field star density is very low and the more massive clusters are easily recognised as resolved into individual stars in their outer regions. The median sky background in this field is about μIE} ≈ 22.6 mag arcsec−2, which is essentially the pure background sky level of the EuclidIE exposures for NGC 2403 (H25; Euclid Collaboration: Scaramella et al. 2022). However, even under these favourable conditions, a confident identification of GCs with masses less than about 105 M⊙ based on (partial) resolution into individual stars is challenging. As crowding increases nearer the centre of the host galaxy, it becomes more difficult to identify clusters reliably. The field near JC15 has a median sky background of μIE} ≈ 21.8 mag arcsec−2, and the outer resolved regions of the GCs now start blending in with the general background of resolved field stars. In the inner field, with μIE} ≈ 20.9 mag arcsec−2, the outer resolved regions of the simulated clusters are now essentially impossible to distinguish, although the central parts are still spatially resolved, and the lowest-mass clusters appear visually similar to a number of other sources of uncertain nature visible in the field.
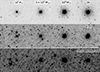 |
Fig. 2. Simulated images of GCs added to the Euclid VIS image of NGC 2403, next to the clusters D6 (top), JC15 (centre), and a new candidate closer to the centre of NGC 2403 (bottom). In each panel, simulated GCs are shown for masses of 105 M⊙, 3 × 10⁵ M⊙, and 106 M⊙ (left to right) a half-light radius of 3 pc, and an assumed age of 10 Gyr. Each panel measures 295 × 70 VIS pixels ( |

Figure 3 shows artificial clusters added to the IC 342 images next to sources ESCC-IC342-551 (top; at  ), ESCC-IC342-525 (middle; at
  ), and ESCC-IC342-396 (bottom; at
  ). Even though the distances (and, hence, physical scales) in Figs. 2 and 3 differ only slightly, the increased extinction towards IC 342 makes it more difficult to recognise individual RGB stars and, consequently, to use this as a robust criterion for identification of GCs. Indeed, the tip-RGB at M(IE) ≈ −3.3 (according to the PARSEC isochrones) will appear at IE ≈ 25.5 in IC 342 and at IE ≈ 24.3 in NGC 2403. For IC 342 this is about 0.7 mag brighter than the expected 5σ detection limit for an isolated point source in the VIS images, while in NGC 2403 (and Holmberg II) the brightest RGB stars are about 2 mag brighter than the detection limit. Younger clusters, in which the brightest individual stars can be far more luminous than the tip-RGB, will be more easily identifiable. The artificial clusters in the lower panel of Fig. 3 have the same masses and sizes as in the top panel, but an age of 20 Myr. The star cluster to the right in this panel is one of the brightest in the disc of IC 342. The difference in brightness between a 10 Gyr old population and a 20 Myr population with the same mass is certainly striking, as is the evident resolution into numerous bright stars in the younger object.
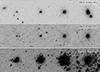 |
Fig. 3. Top and centre panels: As Fig. 2, but for IC 342. Bottom panel: Simulated clusters with the same masses, but for an age of 20 Myr. See text for details. |
4.3. Artificial cluster tests: completeness and photometric uncertainties
Tests of the type described in Sect. 4.2 were also used to quantify the completeness of our candidate samples and the photometric uncertainties. We restricted this analysis to IC 342 as the most ‘complex’ case of the three galaxies, owing to its higher reddening and slightly greater distance compared to NGC 2403 and Holmberg II.
Of the 157 Milky Way GCs in the Harris (1996) catalogue, 146 would fall within the footprint of the Euclid VIS image if projected onto the disc of IC 342. Of these 146 Milky Way GCs, about 87 would have IE < 21.5, corresponding to M(IE) = −7.3 or MV ≈ −6.8 for typical GC colours, and would therefore be bright enough to be included in our candidate list.
To assess what fraction of a Milky Way-like GC population we would actually have identified in the Euclid images, we converted the Galactic heliocentric (X, Y) coordinates of Milky Way GCs in the Harris (1996) catalogue to corresponding CCD (x, y) coordinates in the Euclid VIS image of IC 342. For this conversion, we assumed a distance of 8.4 kpc from the Sun to the Galactic centre along the X-direction (Ghez et al. 2008). We made no attempt to correct for any inclination of IC 342. For each cluster, we adopted the half-light radius and absolute visual magnitude, MV, in the Harris (1996) list and then added theclusters onto the Euclid VIS and NISP images, as well as the MegaCam images, using the same simulation procedure described in Sect. 4.2. The PSFs were constructed for each image in the same way as described for the VIS images (Sect. 4.2). For simplicity, we again assumed the same age (10 Gyr) and metallicity ([Fe/H] = −1) for all clusters. To improve the statistics, each cluster was added four times to the images by inverting the X- and Y-coordinates relative to the centre of IC 342. In this way, a total of 584 artificial Milky Way GCs were added within the Euclid footprint. Figure C.8 shows VIS thumbnail cut-outs of a selection of the simulated Milky Way GCs brighter than IE = 21.5. Most of these stand out quite clearly above the background and would be confidently identified as non-stellar.
We repeated the SExtractor detection procedure, the ISHAPE size measurements, and the DAOPHOT photometry on the IC 342 images with the artificial Milky Way GCs added to them. Figure 4 shows the distributions of input IE magnitudes for all clusters added to the images, those recovered in the VIS images only, and those for which DAOPHOT was able to measure magnitudes in the NISP and MegaCam images. The apparent sharp drop in clusters with NISP and MegaCam photometry below IE = 22 is due to the magnitude cut applied in the master catalogue. We note that this cut was applied to the measured magnitudes, not the input magnitudes, which explains the presence of a few objects with IE > 22. Of the 584 simulated clusters, 359 are brighter than our IE = 21.5 selection limit, and 336 (94%) of these were recovered in the VIS image. For nearly all of the clusters detected in VIS and brighter than IE = 21.5, DAOPHOT was also able to measure magnitudes in the MegaCam and NISP images (330 and 336, respectively). A few clusters have measured sizes smaller than our adopted size cut of FWHM = 0.5 pixels, leaving 319 objects with VIS+MegaCam photometry after the size selection. Dividing by four, we would thus have detected about 80 out of the 87 Milky Way GCs contained within the Euclid footprint that satisfy our magnitude limit. These numbers remain unchanged if we modify the SExtractor DETECT_MINAREA parameter from 6 to 3 connected pixels. Hence, down to our adopted selection limit, we expect to detect more than 90% of any GCs, drawn from a population with properties similar to those of the Milky Way GC population, present within the Euclid footprint. These 80 detected clusters thus represent about half of the total population of 157 Milky Way GCs.
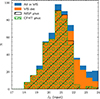 |
Fig. 4. Luminosity functions for simulated Milky Way GCs added to the Euclid images of IC 342. The distributions of input IE magnitudes are shown for all clusters added within the Euclid footprint (blue), those recovered in the VIS images (orange), and those that also have photometry in the NISP (black hatched) and MegaCam images (green circular-hatched). |
We can also use the artificial cluster tests to quantify the uncertainties on the photometry. The input and measured MegaCam/Euclid CMDs are shown in Fig. 5 with our (extinction-corrected) magnitude limit for selection of cluster candidates indicated by the horizontal dashed lines. The scatter in the input colours is caused by the stochastic sampling of the stellar masses, which, like the photometric uncertainties, becomes more pronounced for fainter clusters. The stochastic sampling effects are also more significant in redder bandpasses, where the contribution from giants is more significant. The observed colours scatter fairly symmetrically with respect to the input values, with no evident bias as a function of magnitude. The black error bars show the computed dispersion of the measured colours (excluding outliers lying more than 3σ away from the mean), while the grey error bars show the mean uncertainties reported by DAOPHOT. It is clear that the formal photometric uncertainties underestimate the true uncertainties on the Euclid GC colours, for which the stochastic sampling effects play an important role even at relatively bright magnitudes.
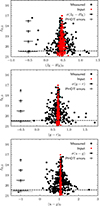 |
Fig. 5. Input and measured colour-magnitude diagrams for artificial Milky Way GCs added to the IC 342 images. The horizontal dashed lines indicate our magnitude limit for selection of cluster candidates. |
4.4. Visual inspection of the candidates
Guided by the simulations just described, the objects remaining after the size- and magnitude cuts were visually classified as ‘unlikely’, ‘maybe,’ or ‘likely’ (globular) clusters. Sources for which individual stars could be visually discerned, at least in the outskirts, were classified as ‘likely’, whereas more ambiguous cases were classified as ‘maybe’. During this inspection, a few additional cluster candidates, not included in the master catalogues, were found and manually added to our candidate lists. Objects that appeared clearly cluster-like, but whose visual appearance was nevertheless deemed inconsistent with a classification as old GCs (such as those in the lower panel of Fig. 3, resolved into stars much brighter than RGB stars, or objects clearly associated with on-going or very recent star formation), were classified as ‘young’. The visual classification was done independently by three of us (AF, JH, SL) and our individual classifications were combined by a generalisation of the scheme described in Howell et al. (2025) to assign the following numerical classes to the objects:
-
at least one ‘unlikely’ classification: class = 5;
-
else: at least one ‘young’ classification: class = 10;
-
else: sources classified as ‘likely’ by all: class = 1;
-
else: sources with at least as many ‘likely’ as ‘maybe’ classifications: class = 2;
-
else: sources with at least one ‘likely’: class = 3;
-
else: (sources classified as ‘maybe’ by all): class = 4.
Objects in the young (class = 10) category are treated separately throughout the remainder of the paper. Cut-outs of all GC candidates are shown in Appendix C with the class indicated for each candidate.
A selection of sources in IC 342 that passed the first round of size and magnitude criteria, but were not included in the list as class 1–4 cluster candidates, are shown in Fig. 6. Since most of these do not have an ESCC (Euclid star cluster candidate) identifier, we identified them based on the IDs in our master catalogue. Some of these are very obvious late-type galaxies (first row), while others are almost certainly early-type galaxies (second row) with very smooth profiles that show no hint at all of resolution into individual stars, despite being located in regions of low background far from the main body of IC 342. Clearly, such cases can be more ambiguous when projected against the disc of our target galaxies. The third row shows four objects in the ‘young’ category. In addition, some saturated foreground stars remained in the list even after the size cut but were generally easy to recognise by their sharp edges and diffraction spikes (fourth row). Similar cases might also be recognisable due to their non-zero Gaia proper motions and/or parallaxes, but this will not always be the case; for example, the relatively faint object #238438 (IE = 20.56) has proper motions of pmRA = +0.25 ± 0.30 mas yr−1, pmDE = −0.51 ± 0.45 mas yr−1, and a parallax of p = −1.27 ± 0.52 mas, and would not be easily identifiable as a foreground star based on Gaia DR3 astrometry, while object #219713 (IE = 20.55) has no Gaia DR3 astrometry at all. Other sources, such as those in the fifth row, could also turn out to be individual luminous stars in IC 342 (or foreground stars projected against the disc); alternatively, they could also be compact clusters. The final row with objects labelled ‘stars’ illustrates the diversity of morphologies seen in crowded regions that frequently exhibit some level of ‘clustering’, but have not generally been included in our lists of cluster candidates.
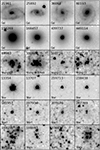 |
Fig. 6. Cut-out images of various sources in IC 342 that passed the magnitude- and size criteria, but were not classified as class 1–4 cluster candidates. Each cut-out measures 5″ × 5″. |
Table 2 lists the number of sources remaining after each stage of the selection: NMaster is the total number of sources in each master catalogue, NSel the number of objects remaining after the magnitude and size selection, and NC = 10, NC = 1 and NC = 2 − 4 the number of young (class 10), class 1, and class 2–4 candidates. The class 5 category encompasses all remaining sources out of the total NSel. The lower fraction of class 1 sources in IC 342 relative to class 2–4, compared to the two other galaxies, is probably caused to some degree by the higher foreground extinction, which makes it more difficult to discern individual stars in the clusters (Sect. 4.2).
Statistics for cluster candidate selection.
For NGC 2403, the class 1–4 candidates listed include the seven previously known old GCs and the eight new candidates identified in H25. Of the 13 class 1–4 candidates in Holmberg II, 9 have been included in previous works (Fig. C.7). Of the three cluster candidates identified by Billett et al. (2002), we classified two as background galaxies (BHE-1, BHE-2), while BHE-3 (our ESCC-HoII-012) is in common with the LEGUSsample (Cook et al. 2019; their #11). We have an additional five candidates in common with LEGUS and three clusters in common with ANGST (Cook et al. 2012). The remaining columns in Table 2, NIAC, NGCC, and NUnknown give the classification statistics for the class 1–4 clusters as intermediate-age or GC candidates based on the MegaCam/LBT photometry, as will be explained and discussed in more detail below.
4.5. Photometry of the cluster candidates
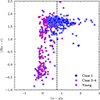 |
Fig. 9. MegaCam Hα − r vs. (u − g)0 two-colour diagram for sources in IC 342. Symbols as in Fig. 7. The dashed line indicates our colour cut for selection of old GC candidates. |
In Fig. 7, we show the Euclid(IE−HE, IE)0 CMDs for the cluster candidates in each galaxy, together with all sources in the master catalogues. The best cluster candidates (class 1, i.e. classified as ‘likely’ unanimously) are indicated with filled blue circles and the more uncertain candidates (class 2–4, i.e. with at least one ‘maybe’ classification) with open blue circles. Class 10 (young) candidates are marked with smaller magenta symbols. For NGC 2403, we also indicate the GCs identified prior to the Euclid ERO observations (solid red circles) and those identified in H25 (open red circles). It is evident that the fraction of class 1 sources is higher among the brighter sources; this is consistent with the artificial cluster simulations (Sect. 4.2) which showed that it becomes increasingly difficult to confidently ascertain the nature of the fainter sources.
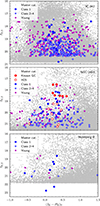 |
Fig. 7. Euclid CMDs. The grey dots show all sources in the master catalogue for each galaxy, while the open and filled blue circles are our new candidates classified as ‘possible’ or ‘likely’, respectively. For NGC 2403, the previously known GCs are shown in red. Formal uncertainties on the photometry are generally less than 0.01 mag, but see Sect. 4.3 for a detailed discussion of the uncertainties. |
Compared to NGC 2403, IC 342 hosts a higher proportion of relatively blue, luminous clusters, which could suggest differences in the age and/or metallicity distributions of the cluster populations. However, there is also a great deal of overlap between the colours of the class 10 candidates and the class1–4 candidates, suggesting that the Euclid colours by themselves might not be very effective at discriminating between clusters of different ages. In Holmberg II, the CMD is clearly much more sparsely populated with cluster candidates than in the two larger galaxies. Two very faint cluster candidates, but nevertheless classified as class 1, were noticed during the visual inspection and added manually to the master catalogue. A few manually added faint candidates in IC 342 are also visible in the CMD.
4.5.1. Simple stellar population model colours
To better understand how the various colours depend on age and metallicity, we plot simple stellar population (SSP) model colours in Fig. 8. The colours are shown as a function of age for three different metallicities ([Fe/H] = −2, −1, and 0) for models based on PARSEC isochrones. It is clear that the EuclidIE−HE colours (top panel) alone are insufficient for determining whether a source might be an old, relatively metal-poor GC or a younger, more metal-rich star cluster; for example, a 10 Gyr old cluster with [Fe/H] = −2 is predicted to have an IE−HE colour similar to that of a solar-metallicity cluster with an age of around 100 Myr. Both combinations are quite likely to be found in a giant spiral like IC 342. While it was reported in H25 that the old GCs in the outer regions of NGC 2403 do have redder colours than the young objects, the models in the upper panel of Fig. 8 suggest that the Euclid colours in general are not ideal for discriminating between young and older star clusters.
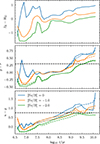 |
Fig. 8. PARSEC simple stellar population model colours versus age. Top: EuclidIE−{HE. Middle: MegaCam g − r. Bottom: MegaCam u − g. For the MegaCam filters, dashed and solid lines indicate models for the old and new MegaCam filters, respectively. The horizontal dashed lines indicate the colour criteria for selection of old GC candidates. |
The two lower panels in the figure show models for the CFHT MegaCam colours. Dashed and solid lines indicate models for the old and new MegaCam filters, for observations made before and after 2015, respectively. We note that the NGC 2403 observations were made with the old filters and those of IC 342 with the new ones. The ugr colours provide better age discrimination than the Euclid colours, although a significant age-metallicity degeneracy is still present at ages older than about 1 Gyr. Adding to this fundamental uncertainty is the unknown contribution from dust reddening internal to the galaxies. Ultimately, these degeneracies can only be alleviated by means of spectroscopic observations and/or resolved CMDs of the clusters. Nevertheless, a selection based on the u − g and g − r colours, with (u − g)0 > 0.75 and (g − r)0 > 0.30, as indicated by the horizontal dashed lines in Fig. 8, should allow us to provide a first, tentative list of clusters older than about 1 Gyr, and we will adopt these criteria for selection of ‘old’ GC candidates throughout the remainder of this paper.
4.5.2. The effect of line emission
The r-band filter includes the Hα line, and can thus be affected by line emission, which is not included in the PARSEC SSP models. The Hα imaging of IC 342 can help us quantify the effect. To this end, Fig. 9 shows a Hα − r versus u − g two-colour diagram for cluster candidates in IC 342. Photometry was carried out on the Hα images in the same way as for the ugr images. Many of the young (class 10) candidates have a strongly enhanced flux in the Hα images (i.e. a lower value of Hα − r), confirming the visual classification of these sources as young. In contrast, none of the sources with u − g colours redder than our adopted selection limit for old GC candidates, indicated by the vertical dashed line, show significantly enhanced Hα emission. We therefore expect that a selection based on the combination of (u − g)0 and (g − r)0 colours will indeed lead to a reasonably clean list of candidate old clusters.
4.6. Globular cluster candidate selection: MegaCam and LBT photometry
In Fig. 10, we show the MegaCam/LBT (g − r)0 versus EuclidIE CMDs with vertical dashed lines indicating our adopted colour cut for selection of old GC candidates. We see that all of the known GCs in NGC 2403, as well as most of the candidates from H25, fall to the right of the colour cut, consistent with these objects being old GCs. Again, many of the young sources have colours overlapping with those expected for old GCs owing to the effect of line emission. However, for the purpose of selecting old GCs, this ambiguity is removed by the inclusion of the u − g colour, except for Holmberg II (where, however, the visual inspection will still help us identify the youngest sources). The lack of stars brighter than IE ≈ 18−19 in Holmberg II is caused by saturation in the deep LBT exposures.
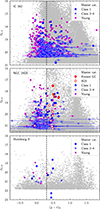 |
Fig. 10. EuclidIE vs. MegaCam (g − r)0 CMDs. For Holmberg II, the g − r photometry is from LBT. Symbols are the same as in Fig. 7. |
Figure 11 shows a two-colour diagram of (g − r)0 versus (u − g)0. Based on this diagram, we will henceforth refer to class 1–4 objects in the upper right quadrant of this figure as GC candidates (GCC), those in the two left quadrants as intermediate-age candidates (IAC), and those in the lower right quadrant as ambiguous. We reserve the term young cluster candidates for our class 10 sources. For Holmberg II, this categorisation is based on the g − r colours only. The numbers of objects in each of these categories are listed in the last three columns of Table 2. Very roughly, the candidates in the young category probably have ages up to about 10 Myr, the IAC sources up to ∼1 Gyr, and GCC sources ages greater than about 1 Gyr. We emphasise that these age ranges are only rough indications.
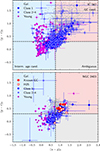 |
Fig. 11. MegaCam-only two-colour diagrams. The coloured quadrants indicate the classification of our class 1–4 candidates as GC candidates (red), intermediate-age candidates (blue), or ambiguous (grey). Small grey points indicate sources classified as galaxies during the visual inspection. |
Based on the MegaCam colour selection, we identified 49 GC candidates in NGC 2403 and 111 in IC 342 (Table 2); based on the LBT g − r colours alone, 7 GC candidates were identified in Holmberg II. The status of these sources as GC candidates should be strongly emphasised, but we note that the total number of GC candidates in NGC 2403 is quite similar to that expected based on the total mass of the galaxy. The 111 candidates in IC 342 might be compared with the 157 known GCs in the Milky Way and more than 450 in M31, where we recall from Sect. 4.3 that we would have expected to detect about 80 of the 157 Milky Way GCs at the distance of IC 342. For comparison with Holmberg II, we note that the SMC, of comparable luminosity, hosts only one object that is traditionally classified as an old GC, NGC 121, although it hosts several clusters with ages ≳1 Gyr (Glatt et al. 2009; Parisi et al. 2014).
We note that a smaller number of class 10 sources also fall within the quadrant with GC-like colours (12 objects in IC 342 and six in NGC 2403). Following a re-examination of these objects, we find that a handful of them could be visually misclassified older clusters, while the rest might be reddened or subject to stochastic colour fluctuations.
4.7. Spatial distributions
The spatial distributions of the class 1–4 cluster candidates are plotted on top of the VIS images in Figs. B.1–B.3, colour-coded according to their classification as intermediate-age (blue), old (red), or ambiguous (black circles) based on the MegaCam colours. The intensity scale is logarithmic in order to emphasise the faint outer parts of the galaxies. We do not include the class 10 sources in these figures.
Many of the IAC sources in IC 342 tend to be aligned with structure in the underlying disc, such as the spiral arms, while the old GC candidates are somewhat more uniformly distributed. Nevertheless, some GC candidates also align with disc structure, such as the outer spiral arm extending towards the south-west (also compare with the maps in H25). Keeping in mind the relatively crude age dating based on the MegaCam colours, it is possible that some of these are somewhat younger disc objects rather than ancient GCs associated with the spheroidal component(s) of IC 342. The median projected galactocentric distances of the IAC and GCC sources are 5.3 kpc and 5.7 kpc, respectively. For comparison, the median Galactocentric distance of the Milky Way GCs in the Harris (1996) catalogue, projected onto the Galactic plane, is 5.0 kpc. For the M31 GC system, we add the PAndAS clusters identified by Huxor et al. (2014) to the confirmed GCs in v.5 of the Revised Bologna Catalogue (Galleti et al. 2004), where the latter already includes the PAndAS clusters from Huxor et al. (2008). This yields a median projected galactocentric distance of confirmed M31 GCs of 7.0 kpc. Quantified in this crude sense, the spatial distribution of the IC 342 GCs is thus intermediate between those of the Milky Way and M31.
For NGC 2403 (Fig. B.2), the spatial distribution of the GCC sources is noticeably more extended (median distance = 3.7 kpc) than that of the IAC sources (2.7 kpc). There is a deficit of sources near the centre, in part because a significant number of sources are missed by SExtractor, probably due to the difficulty of deblending detections in the crowded inner regions. Apart from the cluster ESCC4, all of the IAC sources are located within 7′ of the centre of NGC 2403, while 11 old GC candidates are found outside this radius. It is also interesting to note that the distribution of the old GCs appears to be aligned with the major axis of NGC 2403, except for the cluster ESCC5 (towards the south). This might suggest that most of the GCs in NGC 2403 follow a more disc-like distribution. As in IC 342, it is possible that some of these objects are younger clusters with ages of only a few gigayears (Gyr). They could possibly be even younger, reddened objects. The impression of a disc-like distribution might be partly driven by the four clusters located to the north-west, roughly aligned along an extension of the major axis. An alternative interpretation is that these GC candidates might be associated with the stream connecting DDO 44 and NGC 2403 (Veronese et al. 2023; Carlin et al. 2024), extending northwards from the western side of NGC 2403.
For Holmberg II the distribution of our new cluster candidates is noticeably asymmetric and skewed towards the western side of the galaxy. Figure B.3 also includes our class 10 sources and candidates from the literature and it can be seen that these are more evenly distributed, perhaps even with an opposite asymmetry. The asymmetry might reflect an age gradient across the galaxy, with more active/recent star formation on the eastern side, where the most prominent HII regions are also found. Interestingly, the distribution of HI gas exhibits a similar asymmetry, being compressed on the south-eastern side and with a more diffuse extension in the opposite direction (Bureau & Carignan 2002). The two faintest objects in our list, ESCC-HoII-001 and ESCC-HoII-002, which were manually added, are not included in any of the existing catalogues, although ESCC-HoII-001 is contained within the field of view of a single parallel HST/WFC3 F775W observation with an exposure time of 490 s (programme ID 16359). The HST observation shows a faint source at the position determined from the Euclid image, contaminated by several cosmic ray hits. We discuss these two outer sources in more detail below (Sect. 5.2).
4.8. Comparison with HST imaging
We have indicated the coverage of existing HST/ACS observations in the F435W/F606W filters by superimposing them on the VIS images of IC 342 and NGC 2403. The enormous gain in spatial coverage by the Euclid observations is immediately visible. Also included for NGC 2403 is the JWST/NIRCAM pointing of Programme ID 1638, which contains none of our candidates, but illustrates the difference in FOV sizes of Euclid versus JWST.
The HST footprints for IC 342 include 41 of our 111 GC candidates and 69 of our 172 IAC candidates. The HST/ACS F606W cut-outs of our GC candidates in IC 342 are shown in Fig. C.9. Based on inspection of the HST images of these candidates, our classifications based on the Euclid images did not change significantly for all but a few sources, such as ESCC-IC342-244, ESCC-IC342-330, and ESCC-IC342-355, which have somewhat irregular appearances in the HST images suggesting they might be younger objects.
As a check of the size measurements on the Euclid images we also measured sizes for the GC candidates contained within the HST images, again using ISHAPE with custom-made PSFs constructed from isolated stars in the HST images. Thecomparison is shown in Fig. 12. Most of the measurements lie well within  (i.e. one Euclid VIS pixel) of the 1:1 relation, as indicated by the dashed and dotted lines in the figure. One source, ESCC-IC342-241, is unresolved in the HST images and is thus a probable star, whereas the fits to the Euclid images returned a PSF-corrected FWHM of 1.67 pixels. The reason for the discrepancy is possibly related to the fact that the source is located only 60″ from the nucleus of IC 342, where the background is very high. Excluding this and another outlier falling outside the dotted (
 ) lines in Fig. 12, the dispersion of the FWHM measurements around the 1:1 relation is
  (1/3 of a VIS pixel), corresponding to a dispersion of 0.82 pc on the half-light radii at the distance of IC 342. We note that this is about 4 times larger than the uncertainty quoted by Euclid Collaboration: Voggel et al. (2025) for GCs in Fornax. While the scatter here includes contributions from both the Euclid and HST size measurements, this underscores the need to assess the uncertainties on this type of analysis individually for each case.
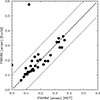 |
Fig. 12. Comparison of sizes for GC candidates in IC 342 measured on the Euclid VIS images and on HST/ACS F606W images. |
4.9. Sizes of the cluster candidates
Figure 13 shows the half-light radii as a function of M(IE) for cluster candidates in each of the three galaxies. Symbols are again colour-coded according to the classification of the clusters as GC (red) or IAC (blue) candidates. We have omitted the unclassified objects and the class 10 objects. For reference, we also show the corresponding relations for Milky Way GCs, using the half-light radii from Harris (1996).
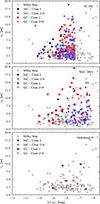 |
Fig. 13. Half-light radius as a function of M(IE) for star cluster candidates. In each panel, the corresponding data for Milky Way GCs are shown for reference. |
The old GC candidates brighter than M(IE) ≈ −8.5 generally have half-light radii in the range 2–5 pc, similar to what is seen for the Milky Way GCs. At fainter magnitudes, however, the spread in the sizes increases considerably, with a tail extending up to rh ≈ 15 pc. By comparison with Fig. 12, it is clear that this scatter cannot be attributed to uncertainties on the size measurements. Nor is the scatter driven by sources with uncertain classifications; many of the largest candidates are high-confidence class 1 clusters (filled circles). While the Milky Way does host a number of similarly large GCs, they are rarer than in either of the two spirals studied here. A Kolmogorov–Smirnov test confirms that the size distributions of old GC candidates in both NGC 2403 and IC 342 differ significantly from that of the Milky Way GCs, with K–S p-values of 3.5 × 10⁻⁶ and 10−8, respectively. The difference between NGC 2403 and IC 342 is not highly significant, at p = 0.10.
Figure 14 shows the measured cluster sizes as a function of the projected galactocentric distances. The coloured symbols have their usual meaning and in addition the solid lines connect the median values in bins of 10 clusters. As is well known (van den Bergh et al. 1991; Baumgardt & Hilker 2018), there is a correlation between size and Galactocentric distance for Milky Way GCs. This trend does become somewhat weaker when projected onto the 2D plane, but it is still noticeable in Fig. 14. It is less evident that such a trend is present in our data, and the median sizes are seen to be larger than in the Milky Way, driven upwards by the larger fraction of extended clusters. It is, however, somewhat striking that no clusters larger than about 10 pc are found in IC 342 outside a projected galactocentric distance of ∼12 kpc, coinciding roughly with the outer edge of the IC 342 disc (H25). This might suggest that the fainter, extended clusters constitute a disc population that is distinct from the classical GCs. In this sense, NGC 2403 is different since it does have a number of relatively large clusters beyond the point where the surface brightness of the disc starts to drop rapidly, at about 5 kpc (H25).
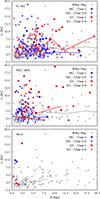 |
Fig. 14. Cluster half-light radii versus projected galactocentric distance for globular and young clusters, compared with Milky Way GCs. The coloured lines show median values for the corresponding types of clusters in bins of 10. |
5. Discussion
5.1. Globular clusters: Specific frequencies and luminosity functions
When calculating GC specific frequencies, a common approach to circumventing the difficulty of identifying the faintest clusters is to assume that the GCLFs follow the roughly Gaussian distributions as a function of magnitude commonly observed, and then to double the number of objects brighter than the peak (Harris & van den Bergh 1981). In NGC 2403, IC 342, and Holmberg II there are 19, 45, and 2 old GC candidates with M(IE) < −8, so that the estimated total populations would then be ∼38, ∼90, and ∼4 GCs in each galaxy. For the MV values in Table 1, the corresponding specific frequencies are then SN = 0.81 (NGC 2403), SN = 0.27 (IC 342), and SN = 0.62 (Holmberg II). These are fairly typical values, albeit somewhat on the low side for IC 342. This does not account for any clusters that might lie outside the Euclid footprint, but this would probably be a minor correction for NGC 2403 and Holmberg II, and even for IC 342 if the radial structure of its GC system is similar to that of the Milky Way. However, we could be missing a more extended component of the GC system, such as that associated with M31.
The fact that the total numbers of GCs actually detected in each galaxy (Table 2) exceed those estimated in the previous paragraph suggests that the simple characterisation in terms of total GC numbers and SN might be somewhat deceptive. Indeed, comparing the GCLFs in more detail (Fig. 15), it becomes clear that neither the NGC 2403 nor IC 342 GCLFs match that of the Milky Way particularly closely (for Holmberg II the small number of candidates makes such a comparison less conclusive). The requirement that candidates must pass our visual inspection might contribute to a decrease in completeness towards the selection limits (dashed lines in Fig. 15), despite the fact that our tests in Sect. 4.2 suggest a better than 90% detection efficiency all the way down to IE = 21.5. With this in mind, we conclude that the LFs of neither IAC nor GC candidates show a clearly detected peak or turn-over, although such a detection would have been expected, at least for NGC 2403, based on comparison with the Milky Way GCLF. Here it is important to recall that our GC candidate samples might include younger objects scattering across the boundaries defining the separation between IAC and GCC samples (Fig. 11), particularly at the faint end where the photometric uncertainties increase.
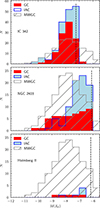 |
Fig. 15. Luminosity functions of class 1–4 cluster candidates in each of the three galaxies, compared with the Milky Way GCLF. The dashed lines indicate the IE = 21.5 selection limits for the cluster candidates. |
For IC 342, however, the bright end of the GCLF shows a real and significant deficit of GCs compared to the Milky Way. The Milky Way has 30 GCs that would have IE, 0 ≲ 19, or M(IE) ≲ −9.7, at the distance of IC 342, while we find only 11 old GC candidates in this magnitude range in IC 342. A naive scaling based on these numbers would then suggest that IC 342 hosts only ∼11/30 × 157 = 58 ‘true’ GCs, an even smaller number than that obtained by doubling the number of clusters brighter than the GCLF turn-over, and implying an even lower SN = 0.18. It thus appears that the GCLF in IC 342 could indeed be somewhat ‘bottom-heavy’ compared to that of the Milky Way. This could be partly due to the same effect noted for NGC 2403, that is, the sample of GC candidates possibly being contaminated by younger objects and/or background galaxies. We recall that other properties of the fainter candidates suggest that some fraction of them might not be classical GCs (Sect. 4.9). If, indeed, IC 342 only hosts on the order of 60 classical GCs, then this would imply that about half of the 111 candidates actually identified are of a different nature.
As there is no sharp separation between the regions of the (u − g, g − r) plane (Fig. 11) defining our IAC and GCC sources, we briefly discuss the sensitivity of the preceding results to the colour criteria employed. In particular, the SSP models in Fig. 8 suggest that a bluer colour limit, for instance, at (u − g)0 = 0.6, would lead to a more complete sample of metal-poor GC candidates. At the same time, however, this would also be expected to increase the fraction of intermediate-age interlopers in our GC candidate sample, particularly if some reddening is present. In fact, changing the (u − g)0 limit to 0.6 mainly affects the statistics of the fainter part of the GCC samples: the total numbers of GC candidates increase from 111 to 130 (IC 342) and from 49 to 51 (NGC 2403), while the number of GC candidates brighter than M(IE) = −8 increases slightly from 45 to 49 in IC 342 and remains unchanged at 19 in NGC 2403. In IC 342, the number of GC candidates with IE < 19 remains unchanged at 11.
Our study would not be the first to suggest an excess of relatively faint, GC-like objects; this has also been found by HST-based studies of other spirals, such as NGC 6946, M101, NGC 628, and NGC 3627, where these fainter objects appear to be associated with the discs of their respective galaxies (Chandar et al. 2004; Barmby et al. 2006; Simanton et al. 2015; Floyd et al. 2024). The diversity of cluster demographics is also illustrated by the ‘faint fuzzy’ or ‘diffuse’ star clusters that have been identified in a number of S0-type galaxies (Brodie & Larsen 2002; Peng et al. 2006; Hwang & Lee 2006), as well as in M31 (Huxor et al. 2005, 2014), NGC 6822 (Howell et al. 2025; Hwang et al. 2011) and other galaxies. These again tend to be fainter than the GCLF turn-over and have half-light radii in the range 7–15 pc, not unlike the excess fainter clusters that we have identified in IC 342 and, in smaller numbers, in NGC 2403. The relatively large sizes of several of the GCs located outside the main disc of NGC 2403 are also reminiscent of those measured for GCs in the outskirts of M33 (Cockcroft et al. 2011). More reliable estimates of the ages and other properties of the clusters will require follow-up spectroscopy or deeper, multi-colour space-based imaging.
Capitalising on Euclid’s unique suitability for mapping the outer regions of GC systems, we can also compare the number of GC candidates in IC 342 beyond the R = 10 kpc circle indicated in Fig. B.1 with statistics for the Milky Way and M31. Outside the 10 kpc circle, we find 13 GC candidates in IC 342. Using the data from Sect. 4.3 to project the simulated Milky Way GC system onto the same part of the Euclid footprint, we find a very similar number of GCs (12) brighter than our IE = 21.5 selection limit. For the brightest clusters (IE < 19), for which the IC 342 GC system as a whole has a deficit with respect to that of the Milky Way, the comparison for the outer regions is less conclusive: there are two such GCs in the Milky Way and none in IC 342. For comparison, M31 has 78 GCs with projected radii between 10 kpc and 20 kpc and estimated IE magnitudes brighter than 21.5 (here assuming V−{IE = 0.5) if shifted to the distance and extinction of IC 342. Hence, while the data allow for the existence of a GC system in the outer regions of IC 342 roughly comparable to what is found in the Milky Way, a GC system as rich as that associated with M31 appears to be clearly ruled out. NGC 2403, finally, has a total of seven GC candidates outside 10 kpc, a fairly similar number to the five found in M33 (Cockcroft et al. 2011).
5.2. Globular clusters: colours and metallicities
Figure 16 shows the Euclid CMDs and colour distributions for the old GC candidates in each galaxy together with Euclid photometry for spectroscopically confirmed GCs in the Fornax cluster (Saifollahi et al. 2025). On the top axis we indicate the colours corresponding to [Fe/H] = −2.5, −1.0, −0.5, and 0, according to the PARSEC SSP models. Here, we used models for an age of 12.5 Gyr, recalling that the Euclid colours depend only weakly on age (Fig. 8).
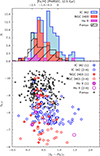 |
Fig. 16. Colour distributions of GC candidates in the three Showcase galaxies. Also included are data for spectroscopically confirmed GCs in the Fornax cluster (Saifollahi et al. 2025). |
The colour distribution of the Fornax GCs extends to somewhat bluer colours than in the three Showcase galaxies. This could be partly due to the colour cuts applied when selecting the Showcase GC candidates: these cuts were intended to reduce contamination by younger clusters, but might also have eliminated some genuine old, very metal-poor GCs. However, changing the selection limit to (u − g)0 = 0.6 does not significantly modify the (IE−HE)0 colour distributions of our GC candidates. There are about 10 sources with much redder colours, (IE−HE)0 > 1.2, than predicted by the SSP models for any age/metallicity combination, most of which are associated with IC 342. We have inspected Herschel SPIRE and PACS images of IC 342 and found no particularly prominent features that might suggest a strong increase in Galactic foreground extinction at the locations of these objects. We also attempted to apply corrections for local variations in the reddening, based on the colours of RGB stars (Annibali et al., in prep.) but found this to have a negligible impact on our results, much less being able to account for the very red sources in IC 342. However, most of them tend to be located in dense regions of the IC 342 disc and it is possible that some are heavily reddened, younger objects. For example, one of these sources, ESCC-IC342-091, a high-confidence cluster candidate (Figs. C.2 and C.9), is associated with enhanced emission in a WISE 12 μm image, where PanSTARRS colour images also suggest the presence of significant dust extinction. Other sources might be misclassified background galaxies. We also note, from the artificial cluster experiments (Fig. 5), that a small number of clusters scatter far from the input colours; hence, the effects of photometric uncertainty cannot be entirely discounted.
Within the range of ‘normal’ GC colours, some differences between the four systems might be noted. The colour distribution for GC candidates in IC 342 appears to be more heavily weighted towards relatively red colours. Comparing with the CMD in the lower panel, we see that this is mainly due to the fainter objects discussed previously and, again, this suggests that these might be relatively low-mass, metal-rich, and/or reddened objects associated with the disc. In all three galaxies, the histograms suggest a peak in the colour distribution around (IE−HE)0 ≈ 0.3, while IC 342 and NGC 2403 also have peaks at redder colours. A KMM test for bimodality (Ashman et al. 1994) confirms the visual impression that the colour distributions for GC candidates in both spirals are better approximated by a sum of two Gaussians than by a single Gaussian. For candidates in the range 0 < (IE−HE)0 < 1.2, the KMM test returns p-values of 0.003 and 0.001, respectively, with peaks at (IE−HE)0 = 0.36 and 0.79 in both galaxies. Converting these colours to metallicities using the 12.5 Gyr PARSEC models, we find [Fe/H] = −1.26 and [Fe/H] = −0.29 for IC 342 and [Fe/H] = −1.26 and [Fe/H] = −0.28 for NGC 2403. A correction for an assumed α-enhanced composition of the GCs would decrease these values by about 0.2 dex, and the mean metallicities of the two populations would then be fairly similar to the mean metallicities of the metal-poor and metal-rich GCs in the Milky Way (Zinn 1985) and other large galaxies (Larsen et al. 2001b; Peng et al. 2006). The effect of changing the colour limit for GC candidate selection to (u − g)0 = 0.6 is minimal: the mean colours returned by the KMM analysis change by only 0.01 mag.
In Holmberg II, seven GC candidates have LBT colours suggesting they might be old GCs. Three of these are included in the LEGUS catalogue with poorly constrained ages (our IDs ESCC-HoII-015, ESCC-HoII-013, and ESCC-HoII-012, with LEGUS IDs #4220, #3, and #11, respectively). The faint, outlying objects ESCC-HoII-001 and ESCC-HoII-002, both classified by us as class 1 GC candidates, do not appear to have been noticed previously. Both have a (g − r)0 = 0.44 with uncertainties of 0.01–0.02 mag, while the Euclid colours are (IE−HE)0 = 0.257 ± 0.014 and 0.028 ± 0.019, respectively, consistent with them being old, metal-poor GCs. Both are quite extended with rh = 15 pc and 30 pc, respectively, raising the question whether they are more properly classified as stellar clusters or perhaps rather as ultra-faint dwarf galaxies (UFDs). With absolute magnitudes of M(IE) = −5.3 and −4.8, they are about 3 mag fainter than the peak of the GCLF, and thus located in the region of the size-luminosity space where properties of GCs and UFDs overlap (Drlica-Wagner et al. 2015; Simon 2019). Of the two Local Group ERO targets, NGC 6822 has six known extended clusters with rh > 10 pc (including one object newly discovered in the ERO data), of which two are faint objects with magnitudes comparable to those of the two objects in Holmberg II (Hwang et al. 2011; Huxor et al. 2013; Howell et al. 2025). No such clusters have so far been found in IC 10.
5.3. The young star cluster systems
Finally turning briefly to the younger cluster candidates, we show the luminosity functions (LFs) for the IAC and young candidates in Fig. 17. The filled and open histograms show the LFs for the class 1–4 IAC candidates and the class 10 candidates, respectively. From a maximum-likelihood fit of a power-law to the LFs of the IAC candidates in IC 342 with M(IE) < −8, dN/dL ∝ Lα, we find a slope of α = −2.64 ± 0.26, and α = −2.37 ± 0.10 for the combined young/intermediate-age sample. Combining the IAC and young clusters brighter than M(IE) = −8 in all three galaxies, we get α = −2.32 ± 0.09. These slopes are similar to those reported for young cluster populations in a variety of other star-forming galaxies (e.g. Larsen 2002; Whitmore et al. 2014). Such relatively steep cluster LFs are consistent with a scenario in which the underlying cluster mass function has the shape of a power-law with an exponent close to −2 at low masses, with an exponential truncation at a mass that depends on the intensity of star formation, but is typically in the range of several times 104 M⊙ to a few times 105 M⊙ in normal star-forming galaxies (Larsen 2009; Portegies Zwart et al. 2010; Johnson et al. 2017).
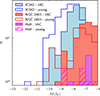 |
Fig. 17. Luminosity functions of young star cluster candidates. |
While no particular effort has been made to ensure or quantify the completeness of the young cluster samples, it is interesting to compare the statistics for candidates in Holmberg II and NGC 2403 with their Local Group analogues, the SMC and M33. The PHATTER cluster catalogue for M33 includes 22 clusters with MF814W < −8 (Johnson et al. 2022), where we have converted the Vega magnitudes in the PHATTER catalogue to AB magnitudes for consistency with the EuclidIE magnitudes. This is just slightly less than our combined sample of 8 + 18 = 26 intermediate-age and young candidates in NGC 2403, consistent with the two galaxies having roughly similar star-formation rates. For the SMC, we use the cluster catalogue by Rafelski & Zaritsky (2005) and convert their I magnitudes to the AB system by adding 0.45 mag (Blanton & Roweis 2007). In this way we find 9 SMC clusters with MI, AB < −8. The difference with respect to the three young+IAC clusters in Holmberg II might be partly explained by the somewhat higher star-formation rate of the SMC (Sect. 3). In addition to homogenising the photometric data, a more refined analysis should also adopt a uniform strategy for identification of young clusters in different galaxies.
6. Summary and conclusions
We present our analysis of the star cluster populations in three nearby galaxies, IC 342, NGC 2403, and Holmberg II, observed as part of the Euclid Early Release Observations programme. For IC 342, this is the first study of stellar clusters (other than the nuclear cluster). Our main focus old clusters, where the Euclid observations have the greatest potential for improvement over existing studies as they allow a more complete census of the cluster populations also in the outer regions of galaxies. At distances of 3.20–3.45 Mpc, the Euclid field of view covers a region of 39 kpc × 45 kpc to 42 kpc × 48 kpc around each galaxy, which is large enough to include about 90% of the known Milky Way GC system when set at the distance of our target galaxies; we note, however, that the M31 GC system has about 100 GCs, or about 20% of the entire population, falling outside 20 kpc). Our main results are as follows.
-
We identified 111, 49, and 7 old GC candidates in IC 342, NGC 2403, and Holmberg II, respectively. These numbers include 15 previously identified GC candidates in NGC 2403 (including 8 candidates from H25) and 2 faint, extended (rh = 15 pc and 30 pc), and previously unknown stellar systems outside the main body of Holmberg II. With M(IE) = −5.3 and −4.8, it is unclear whether the latter are stellar clusters or UFDs.
-
The median (projected) galactocentric distances of the GC candidates in IC 342 and NGC 2403 are 5.7 kpc and 3.7 kpc, respectively. Compared with the corresponding values for the Milky Way (5.0 kpc) and M31 (7.0 kpc), these values thus appear fairly typical.
-
By doubling the numbers of GCs brighter than M(IE) = −8, corresponding to the expected peak of the GC luminosity function, we find specific frequencies of SN = 0.28 (IC 342), 0.81 (NGC 2403), and 0.62 (Holmberg II). The values for NGC 2403 and Holmberg II are fairly typical for late-type galaxies, but somewhat on the low side for IC 342. The total GC population of NGC 2403 also agrees well with expectations based on the relation between galaxy mass and GC numbers (Burkert & Forbes 2020; Forbes et al. 2022).
-
In both IC 342 and NGC 2403, we find an excess of relatively faint clusters compared to the canonical, approximately Gaussian, shape of the GC luminosity function, as reported previously for other spiral galaxies. The faint, extended, predominantly red clusters in IC 342 are largely confined to the disc and resemble the ‘faint fuzzy’ star clusters observed in the discs of some lenticular galaxies. NGC 2403, by contrast, also hosts a number of relatively extended clusters beyond the disc, as found previously for M31 (Huxor et al. 2014) and M33 (Cockcroft et al. 2011).
-
The EuclidIE−HE colours are consistent with the GC candidates spanning a broad range of metallicities, −2.5 ≲ [Fe/H] ≲ 0. Both IC 342 and NGC 2403 exhibit bimodal colour distributions with mean metallicities similar to those of the metal-poor and metal-rich GC subpopulations observed in the Milky Way and other large galaxies.
-
Based on a power-law fit to the combined LFs of the young and intermediate-age candidates, we find a slope of −2.32 ± 0.09, similar to what has been reported in previous studies of young cluster populations in a variety of galaxies.
Despite the relatively small sample of galaxies investigated here, the comparison with their Local Group analogues has yielded intriguing hints that interesting trends might emerge from studies of larger samples. On the one hand, the GC systems of M33 and NGC 2403 appear similar in many respects, including the total number of GCs, their spatial distributions, and the presence of a number of relatively extended clusters in the outskirts of the galaxies. In contrast, the GC system of IC 342 differs more significantly from those of the Milky Way and M31, in particular, regarding the relatively small number of luminous GCs present in IC 342. If we adopted the view that a significant fraction of the GC populations around major galaxies are associated with accretion events, we might speculate that IC 342 has had an unusually quiescent accretion history. It would be of great interest to investigate the characteristics of the stellar halo, for instance, in terms of its spatial and metallicity distributions, and compare this information to that of its Local Group counterparts.
The preceding analysis demonstrates the power of the large field of view, combined with exquisite image quality offered by Euclid, for studies of nearby galaxies. The full Euclid Wide Survey will not be limited by the coverage of a single observation, but it will provide contiguous coverage of thousands of square degrees of sky, including many galaxies in the Local Universe where studies similar to the one presented here can be undertaken. The analysis presented here also demonstrates the powerful combination of the high resolution imaging provided by Euclid with ground-based multi-colour photometry, not only for the core science, but also for legacy science on stellar populations. Thus, the results presented in this paper should not be seen as definitive, but rather as a preview of things to come.
Data availability
The full Table A.1 is available at the CDS via https://cdsarc.cds.unistra.fr/viz-bin/cat/J/A+A/703/A113
Acknowledgments
The Euclid Consortium acknowledges the European Space Agency and a number of agencies and institutes that have supported the development of Euclid, in particular the Agenzia Spaziale Italiana, the Austrian Forschungsförderungsgesellschaft funded through BMK, the Belgian Science Policy, the Canadian Euclid Consortium, the Deutsches Zentrum für Luft- und Raumfahrt, the DTU Space and the Niels Bohr Institute in Denmark, the French Centre National d’Etudes Spatiales, the Fundação para a Ciência e a Tecnologia, the Hungarian Academy of Sciences, the Ministerio de Ciencia, Innovación y Universidades, the National Aeronautics and Space Administration, the National Astronomical Observatory of Japan, the Netherlandse Onderzoekschool Voor Astronomie, the Norwegian Space Agency, the Research Council of Finland, the Romanian Space Agency, the State Secretariat for Education, Research, and Innovation (SERI) at the Swiss Space Office (SSO), and the United Kingdom Space Agency. A complete and detailed list is available on the Euclid web site (www.euclid-ec.org). This work has made use of the Early Release Observations (ERO) data from the Euclid mission of the European Space Agency (ESA), 2024, https://doi.org/10.57780/esa-qmocze3. AMNF is supported by UK Research and Innovation (UKRI) under the UK government’s Horizon Europe funding guarantee [grant number EP/Z534353/1] and by the UK Science and Technology Facilities Council [grant number ST/Y001281/1]. JMH acknowledges funding from the Bell Burnell Graduate Scholarship Fund (BB0015). MNL is funded by the European Union (MSCA EDUCADO, GA 101119830). Views and opinions expressed are however those of the author(s) only and do not necessarily reflect those of the European Union. Neither the European Union nor the granting authority can be held responsible for them. This work has made use of the Early Release Observation (ERO) data from the Euclid mission of the European Space Agency (ESA), 2024, https://doi.org/10.57780/esa-qmocze3. This work is based in part on observations obtained with MegaPrime/MegaCam, a joint project of CFHT and CEA/DAPNIA, at the Canada-France-Hawaii Telescope (CFHT) which is operated by the National Research Council (NRC) of Canada, the Institut National des Science de l’Univers of the Centre National de la Recherche Scientifique (CNRS) of France, and the University of Hawaii. The observations at the Canada-France-Hawaii Telescope were performed with care and respect from the summit of Maunakea which is a significant cultural and historic site.
References
- Adamo, A., Hollyhead, K., Messa, M., et al. 2020a, MNRAS, 499, 3267 [Google Scholar]
- Adamo, A., Zeidler, P., Kruijssen, J. M. D., et al. 2020b, Space Sci. Rev., 216, 69 [Google Scholar]
- Annibali, F., Beccari, G., Bellazzini, M., et al. 2020, MNRAS, 491, 5101 [NASA ADS] [Google Scholar]
- Ashman, K. M., Bird, C. M., & Zepf, S. E. 1994, AJ, 108, 2348 [Google Scholar]
- Barker, M. K., Ferguson, A. M. N., Irwin, M. J., Arimoto, N., & Jablonka, P. 2012, MNRAS, 419, 1489 [CrossRef] [Google Scholar]
- Barmby, P., Kuntz, K. D., Huchra, J. P., & Brodie, J. P. 2006, AJ, 132, 883 [Google Scholar]
- Battistini, P., Bonoli, F., Federici, L., Fusi Pecci, F., & Kron, R. G. 1984, A&A, 130, 162 [NASA ADS] [Google Scholar]
- Baumgardt, H., & Hilker, M. 2018, MNRAS, 478, 1520 [Google Scholar]
- Beasley, M. A., San Roman, I., Gallart, C., Sarajedini, A., & Aparicio, A. 2015, MNRAS, 451, 3400 [Google Scholar]
- Belokurov, V., & Kravtsov, A. 2024, MNRAS, 528, 3198 [CrossRef] [Google Scholar]
- Bernard, E. J., Ferguson, A. M. N., Barker, M. K., et al. 2012, MNRAS, 426, 3490 [Google Scholar]
- Bertin, E., & Arnouts, S. 1996, A&AS, 117, 393 [NASA ADS] [CrossRef] [EDP Sciences] [Google Scholar]
- Billett, O. H., Hunter, D. A., & Elmegreen, B. G. 2002, AJ, 123, 1454 [NASA ADS] [CrossRef] [Google Scholar]
- Blanton, M. R., & Roweis, S. 2007, AJ, 133, 734 [NASA ADS] [CrossRef] [Google Scholar]
- Böker, T., van der Marel, R. P., & Vacca, W. D. 1999, AJ, 118, 831 [CrossRef] [Google Scholar]
- Bressan, A., Marigo, P., Girardi, L., et al. 2012, MNRAS, 427, 127 [NASA ADS] [CrossRef] [Google Scholar]
- Bridges, T. J., & Hanes, D. A. 1992, AJ, 103, 800 [Google Scholar]
- Brodie, J. P., & Larsen, S. S. 2002, AJ, 124, 1410 [Google Scholar]
- Buat, V., & Xu, C. 1996, A&A, 306, 61 [NASA ADS] [Google Scholar]
- Bureau, M., & Carignan, C. 2002, AJ, 123, 1316 [NASA ADS] [CrossRef] [Google Scholar]
- Burkert, A., & Forbes, D. A. 2020, AJ, 159, 56 [Google Scholar]
- Callingham, T. M., Cautun, M., Deason, A. J., et al. 2022, MNRAS, 513, 4107 [NASA ADS] [CrossRef] [Google Scholar]
- Carlin, J. L., Garling, C. T., Peter, A. H. G., et al. 2019, ApJ, 886, 109 [NASA ADS] [CrossRef] [Google Scholar]
- Carlin, J. L., Sand, D. J., Mutlu-Pakdil, B., et al. 2024, ApJ, 977, 112 [Google Scholar]
- Chambers, K. C., Magnier, E. A., Metcalfe, N., et al. 2016, arXiv e-prints [arXiv:1612.05560] [Google Scholar]
- Chandar, R., Bianchi, L., & Ford, H. C. 1999, ApJS, 122, 431 [NASA ADS] [CrossRef] [Google Scholar]
- Chandar, R., Whitmore, B., & Lee, M. G. 2004, ApJ, 611, 220 [Google Scholar]
- Chandar, R., Whitmore, B. C., Dinino, D., et al. 2016, ApJ, 824, 71 [NASA ADS] [CrossRef] [Google Scholar]
- Chen, Y., Bressan, A., Girardi, L., et al. 2015, MNRAS, 452, 1068 [Google Scholar]
- Chies-Santos, A. L., Larsen, S. S., Kuntschner, H., et al. 2011, A&A, 525, A20 [NASA ADS] [CrossRef] [EDP Sciences] [Google Scholar]
- Chies-Santos, A. L., de Souza, R. S., Caso, J. P., et al. 2022, MNRAS, 516, 1320 [Google Scholar]
- Choksi, N., Gnedin, O. Y., & Li, H. 2018, MNRAS, 480, 2343 [NASA ADS] [CrossRef] [Google Scholar]
- Cockcroft, R., Harris, W. E., Ferguson, A. M. N., et al. 2011, ApJ, 730, 112 [Google Scholar]
- Cook, D. O., Seth, A. C., Dale, D. A., et al. 2012, ApJ, 751, 100 [NASA ADS] [CrossRef] [Google Scholar]
- Cook, D. O., Lee, J. C., Adamo, A., et al. 2019, MNRAS, 484, 4897 [NASA ADS] [CrossRef] [Google Scholar]
- Cuillandre, J.-C., Bertin, E., Bolzonella, M., et al. 2025, A&A, 697, A6 [Google Scholar]
- Davidge, T. J. 2007, ApJ, 664, 820 [Google Scholar]
- Davison, T. A., Norris, M. A., Pfeffer, J. L., Davies, J. J., & Crain, R. A. 2020, MNRAS, 497, 81 [Google Scholar]
- de Blok, W. J. G., Walter, F., Brinks, E., et al. 2008, AJ, 136, 2648 [NASA ADS] [CrossRef] [Google Scholar]
- de Meulenaer, P., Narbutis, D., Mineikis, T., & Vansevičius, V. 2014, A&A, 569, A4 [NASA ADS] [CrossRef] [EDP Sciences] [Google Scholar]
- de Vaucouleurs, G., de Vaucouleurs, A., Corwin, H. G., Jr, et al. 1991, Third Reference Catalogue of Bright Galaxies (New York, NY: Springer) [Google Scholar]
- Drissen, L., Roy, J.-R., Moffat, A. F. J., & Shara, M. M. 1999, AJ, 117, 1249 [Google Scholar]
- Drlica-Wagner, A., Bechtol, K., Rykoff, E. S., et al. 2015, ApJ, 813, 109 [Google Scholar]
- Elia, D., Molinari, S., Schisano, E., et al. 2022, ApJ, 941, 162 [NASA ADS] [CrossRef] [Google Scholar]
- Euclid Collaboration (Scaramella, R., et al.) 2022, A&A, 662, A112 [NASA ADS] [CrossRef] [EDP Sciences] [Google Scholar]
- Euclid Collaboration (Cropper, M., et al.) 2025, A&A, 697, A2 [Google Scholar]
- Euclid Collaboration (Jahnke, K., et al.) 2025, A&A, 697, A3 [Google Scholar]
- Euclid Collaboration (Mellier, Y., et al.) 2025, A&A, 697, A1 [Google Scholar]
- Euclid Collaboration (Voggel, K., et al.) 2025, A&A, 693, A251 [Google Scholar]
- Euclid Early Release Observations, 2024, https://doi.org/10.57780/esa-qmocze3 [Google Scholar]
- Flewelling, H. A., Magnier, E. A., Chambers, K. C., et al. 2020, ApJS, 251, 7 [NASA ADS] [CrossRef] [Google Scholar]
- Floyd, M., Chandar, R., Whitmore, B. C., et al. 2024, AJ, 167, 95 [Google Scholar]
- Forbes, D. A. 2020, MNRAS, 493, 847 [Google Scholar]
- Forbes, D. A., & Bridges, T. 2010, MNRAS, 404, 1203 [NASA ADS] [Google Scholar]
- Forbes, D. A., Ferré-Mateu, A., Gannon, J. S., et al. 2022, MNRAS, 512, 802 [NASA ADS] [CrossRef] [Google Scholar]
- Fouesneau, M., & Lançon, A. 2010, A&A, 521, A22 [NASA ADS] [CrossRef] [EDP Sciences] [Google Scholar]
- Galleti, S., Federici, L., Bellazzini, M., Fusi Pecci, F., & Macrina, S. 2004, A&A, 416, 917 [NASA ADS] [CrossRef] [EDP Sciences] [Google Scholar]
- Ghez, A. M., Salim, S., Weinberg, N. N., et al. 2008, ApJ, 689, 1044 [Google Scholar]
- Glatt, K., Grebel, E. K., Gallagher, J. S., III, et al. 2009, AJ, 138, 1403 [NASA ADS] [CrossRef] [Google Scholar]
- Goodwin, S. P. 1997, MNRAS, 286, L39 [Google Scholar]
- Gordon, K. D., Clayton, G. C., Decleir, M., et al. 2023, ApJ, 950, 86 [CrossRef] [Google Scholar]
- Haas, M. R., Gieles, M., Scheepmaker, R. A., Larsen, S. S., & Lamers, H. J. G. L. M. 2008, A&A, 487, 937 [NASA ADS] [CrossRef] [EDP Sciences] [Google Scholar]
- Harris, W. E. 1996, AJ, 112, 1487 [Google Scholar]
- Harris, W. E., & van den Bergh, S. 1981, AJ, 86, 1627 [NASA ADS] [CrossRef] [Google Scholar]
- Harris, J., & Zaritsky, D. 2004, AJ, 127, 1531 [NASA ADS] [CrossRef] [Google Scholar]
- Harris, W. E., Harris, H. C., & Harris, G. L. H. 1984, AJ, 89, 216 [Google Scholar]
- Harris, W. E., Harris, G. L. H., & Alessi, M. 2013, ApJ, 772, 82 [Google Scholar]
- Howell, J. M., Ferguson, A. M. N., Larsen, S. S., et al. 2025, A&A, submitted [arXiv:2509.10440] [Google Scholar]
- Hunt, L., Annibali, F., Cuillandre, J.-C., et al. 2025, A&A, 697, A9 [NASA ADS] [CrossRef] [EDP Sciences] [Google Scholar]
- Huxor, A. P., Tanvir, N. R., Irwin, M. J., et al. 2005, MNRAS, 360, 1007 [Google Scholar]
- Huxor, A. P., Tanvir, N. R., Ferguson, A. M. N., et al. 2008, MNRAS, 385, 1989 [Google Scholar]
- Huxor, A., Ferguson, A. M. N., Barker, M. K., et al. 2009, ApJ, 698, L77 [NASA ADS] [CrossRef] [Google Scholar]
- Huxor, A. P., Ferguson, A. M. N., Veljanoski, J., Mackey, A. D., & Tanvir, N. R. 2013, MNRAS, 429, 1039 [NASA ADS] [CrossRef] [Google Scholar]
- Huxor, A. P., Mackey, A. D., Ferguson, A. M. N., et al. 2014, MNRAS, 442, 2165 [Google Scholar]
- Hwang, N., & Lee, M. G. 2006, ApJ, 638, L79 [Google Scholar]
- Hwang, N., Lee, M. G., Lee, J. C., et al. 2011, ApJ, 738, 58 [NASA ADS] [CrossRef] [Google Scholar]
- Johnson, L. C., Seth, A. C., Dalcanton, J. J., et al. 2017, ApJ, 839, 78 [NASA ADS] [CrossRef] [Google Scholar]
- Johnson, L. C., Wainer, T. M., Torresvillanueva, E. E., et al. 2022, ApJ, 938, 81 [NASA ADS] [CrossRef] [Google Scholar]
- Kang, J., Lee, M. G., Jang, I. S., et al. 2022, ApJ, 939, 74 [Google Scholar]
- Keller, B. W., Kruijssen, J. M. D., Pfeffer, J., et al. 2020, MNRAS, 495, 4248 [NASA ADS] [CrossRef] [Google Scholar]
- King, I. 1962, AJ, 67, 471 [Google Scholar]
- Kluge, M., Hatch, N., Montes, M., et al. 2025, A&A, 697, A13 [NASA ADS] [CrossRef] [EDP Sciences] [Google Scholar]
- Kroupa, P. 2001, MNRAS, 322, 231 [NASA ADS] [CrossRef] [Google Scholar]
- Kruijssen, J. M. D., Pfeffer, J. L., Chevance, M., et al. 2020, MNRAS, 498, 2472 [NASA ADS] [CrossRef] [Google Scholar]
- Larsen, S. S. 1999, A&AS, 139, 393 [NASA ADS] [CrossRef] [EDP Sciences] [Google Scholar]
- Larsen, S. S. 2001, AJ, 122, 1782 [NASA ADS] [CrossRef] [Google Scholar]
- Larsen, S. S. 2002, AJ, 124, 1393 [NASA ADS] [CrossRef] [Google Scholar]
- Larsen, S. S. 2009, A&A, 494, 539 [NASA ADS] [CrossRef] [EDP Sciences] [Google Scholar]
- Larsen, S. S. 2014, Astrophysics Source Code Library [record ascl:1403.013] [Google Scholar]
- Larsen, S. S. 2016, Proc. IAU, 317, 120 [Google Scholar]
- Larsen, S. S., & Richtler, T. 2000, A&A, 354, 836 [NASA ADS] [Google Scholar]
- Larsen, S. S., Brodie, J. P., Elmegreen, B. G., et al. 2001a, ApJ, 556, 801 [Google Scholar]
- Larsen, S. S., Forbes, D. A., & Brodie, J. P. 2001b, MNRAS, 327, 1116 [Google Scholar]
- Larsen, S. S., Eitner, P., Magg, E., et al. 2022, A&A, 660, A88 [NASA ADS] [CrossRef] [EDP Sciences] [Google Scholar]
- Lazzarini, M., Williams, B. F., Durbin, M. J., et al. 2022, ApJ, 934, 76 [Google Scholar]
- Limberg, G., Souza, S. O., Pérez-Villegas, A., et al. 2022, ApJ, 935, 109 [NASA ADS] [CrossRef] [Google Scholar]
- Mackey, A. D., & Gilmore, G. F. 2004, MNRAS, 355, 504 [NASA ADS] [CrossRef] [Google Scholar]
- Mackey, A. D., Huxor, A. P., Ferguson, A. M. N., et al. 2010, ApJ, 717, L11 [NASA ADS] [CrossRef] [Google Scholar]
- Mackey, A. D., Ferguson, A. M. N., Huxor, A. P., et al. 2019a, MNRAS, 484, 1756 [NASA ADS] [CrossRef] [Google Scholar]
- Mackey, D., Lewis, G. F., Brewer, B. J., et al. 2019b, Nature, 574, 69 [NASA ADS] [CrossRef] [Google Scholar]
- Magnier, E. A., & Cuillandre, J. C. 2004, PASP, 116, 449 [NASA ADS] [CrossRef] [Google Scholar]
- Maschmann, D., Lee, J. C., Thilker, D. A., et al. 2024, ApJS, 273, 14 [Google Scholar]
- Massari, D., Koppelman, H. H., & Helmi, A. 2019, A&A, 630, L4 [NASA ADS] [CrossRef] [EDP Sciences] [Google Scholar]
- Nantais, J. B., Huchra, J. P., Zezas, A., Gazeas, K., & Strader, J. 2011, AJ, 142, 183 [Google Scholar]
- Pan, J., Bell, E. F., Smercina, A., et al. 2022, MNRAS, 515, 48 [Google Scholar]
- Parisi, M. C., Geisler, D., Carraro, G., et al. 2014, AJ, 147, 71 [Google Scholar]
- Peng, E. W., Jordán, A., Côté, P., et al. 2006, ApJ, 639, 95 [Google Scholar]
- Perelmuter, J.-M., Brodie, J. P., & Huchra, J. P. 1995, AJ, 110, 620 [Google Scholar]
- Pfeffer, J. L., Trujillo-Gomez, S., Kruijssen, J. M. D., et al. 2020, MNRAS, 499, 4863 [CrossRef] [Google Scholar]
- Pfeffer, J., Kruijssen, J. M. D., Bastian, N., Crain, R. A., & Trujillo-Gomez, S. 2023, MNRAS, 519, 5384 [Google Scholar]
- Popescu, B., & Hanson, M. M. 2010, ApJ, 724, 296 [NASA ADS] [CrossRef] [Google Scholar]
- Portegies Zwart, S. F., McMillan, S. L. W., & Gieles, M. 2010, ARA&A, 48, 431 [NASA ADS] [CrossRef] [Google Scholar]
- Powalka, M., Lançon, A., Puzia, T. H., et al. 2017, ApJ, 844, 104 [Google Scholar]
- Qu, Y., Helly, J. C., Bower, R. G., et al. 2017, MNRAS, 464, 1659 [NASA ADS] [CrossRef] [Google Scholar]
- Rafelski, M., & Zaritsky, D. 2005, AJ, 129, 2701 [NASA ADS] [CrossRef] [Google Scholar]
- Reina-Campos, M., & Kruijssen, J. M. D. 2017, MNRAS, 469, 1282 [CrossRef] [Google Scholar]
- Reina-Campos, M., Keller, B. W., Kruijssen, J. M. D., et al. 2022, MNRAS, 517, 3144 [NASA ADS] [CrossRef] [Google Scholar]
- Saifollahi, T., Voggel, K., Lançon, A., et al. 2025, A&A, 697, A10 [NASA ADS] [CrossRef] [EDP Sciences] [Google Scholar]
- Sarajedini, A., Geisler, D., Harding, P., & Schommer, R. 1998, ApJ, 508, L37 [NASA ADS] [CrossRef] [Google Scholar]
- Sarajedini, A., Geisler, D., Schommer, R., & Harding, P. 2000, AJ, 120, 2437 [NASA ADS] [CrossRef] [Google Scholar]
- Schinnerer, E., Böker, T., & Meier, D. S. 2003, ApJ, 591, L115 [NASA ADS] [CrossRef] [Google Scholar]
- Schlafly, E. F., & Finkbeiner, D. P. 2011, ApJ, 737, 103 [Google Scholar]
- Simanton, L. A., Chandar, R., & Whitmore, B. C. 2015, ApJ, 805, 160 [Google Scholar]
- Simon, J. D. 2019, ARA&A, 57, 375 [NASA ADS] [CrossRef] [Google Scholar]
- Stetson, P. B. 1987, PASP, 99, 191 [Google Scholar]
- Tabatabaei, F. S., & Berkhuijsen, E. M. 2010, A&A, 517, A77 [NASA ADS] [CrossRef] [EDP Sciences] [Google Scholar]
- Tammann, G. A., & Sandage, A. 1968, ApJ, 151, 825 [NASA ADS] [CrossRef] [Google Scholar]
- Tang, J., Bressan, A., Rosenfield, P., et al. 2014, MNRAS, 445, 4287 [NASA ADS] [CrossRef] [Google Scholar]
- Tonry, J. L., Stubbs, C. W., Lykke, K. R., et al. 2012, ApJ, 750, 99 [Google Scholar]
- Trujillo-Gomez, S., Kruijssen, J. M. D., Pfeffer, J., et al. 2023, MNRAS, 526, 5735 [Google Scholar]
- Urbano, M., Duc, P. A., Saifollahi, T., et al. 2025, A&A, 700, A104 [NASA ADS] [CrossRef] [EDP Sciences] [Google Scholar]
- van den Bergh, S., Morbey, C., & Pazder, J. 1991, ApJ, 375, 594 [Google Scholar]
- Veronese, S., de Blok, W. J. G., & Walter, F. 2023, A&A, 672, A55 [NASA ADS] [CrossRef] [EDP Sciences] [Google Scholar]
- Wainer, T. M., Johnson, L. C., Seth, A. C., et al. 2022, ApJ, 928, 15 [NASA ADS] [CrossRef] [Google Scholar]
- Weisz, D. R., Skillman, E. D., Cannon, J. M., et al. 2008, ApJ, 689, 160 [NASA ADS] [CrossRef] [Google Scholar]
- Whitmore, B. C., Chandar, R., Schweizer, F., et al. 2010, AJ, 140, 75 [NASA ADS] [CrossRef] [Google Scholar]
- Whitmore, B. C., Chandar, R., Bowers, A. S., et al. 2014, AJ, 147, 78 [NASA ADS] [CrossRef] [Google Scholar]
- Williams, B. F., Dalcanton, J. J., Stilp, A., et al. 2013, ApJ, 765, 120 [NASA ADS] [CrossRef] [Google Scholar]
- Worthey, G. 1994, ApJS, 95, 107 [Google Scholar]
- Zinn, R. 1985, ApJ, 293, 424 [Google Scholar]
Appendix A: Cluster candidates
Euclid star cluster candidates.
Appendix B: Locations of cluster candidates
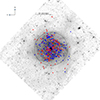 |
Fig. B.1. Euclid VIS image of IC 342 with class 1–4 cluster candidates marked. Old GC candidates are shown with red circles, intermediate-age candidates in blue, and ambiguous candidates as open black circles. The dashed black circle indicates a radius of 10 kpc and the white/magenta dashed lines indicate the HST/ACS F435W+F606W coverage from programmes 10579 and 16002. North is up and east to the left. |
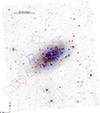 |
Fig. B.2. Euclid VIS image of NGC 2403 with cluster candidates marked. Symbols and orientation of the image are as in Fig. B.1. Also indicated is a JWST/NIRCAM pointing from Programme ID 1638 (dashed blue lines). |
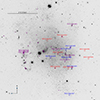 |
Fig. B.3. Euclid VIS image of the central 400″ × 400″ around Holmberg II with cluster candidates marked. As in Fig. B.1, red and blue circles indicate our old GC and IAC candidates, respectively. Large magenta circles indicate young (class 10) objects and smaller magenta markers indicate clusters from the LEGUS survey (Cook et al. 2019). |
Appendix C: Cutouts of cluster candidates
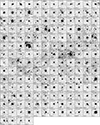 |
Fig. C.1. Cut-outs of clusters in IC 342 classified as intermediate-age candidates based on their MegaCam colours. The ID of each cluster is indicated with the leading ‘ESCC’ stripped. Each cut-out measures 5″ × 5″. |
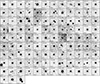 |
Fig. C.2. Cut-outs of clusters in IC 342 classified as GC candidates based on their MegaCam colours. Each cut-out measures 5″ × 5″. |
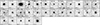 |
Fig. C.3. Cut-outs of clusters in IC 342 with ambiguous MegaCam colours. Each cut-out measures 5″ × 5″. |
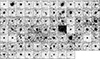 |
Fig. C.4. Cut-outs of intermediate-age cluster candidates in NGC 2403. Each cut-out measures 5″ × 5″. |
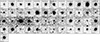 |
Fig. C.5. Cut-outs of GC candidates in NGC 2403. Each cut-out measures 5″ × 5″. |
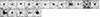 |
Fig. C.6. Cut-outs of ambiguous cluster candidates in NGC 2403. Each cut-out measures 5″ × 5″. |
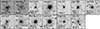 |
Fig. C.7. Cut-outs of cluster candidates in Holmberg II. The objects HoII-001 and HoII-002 are shown at a higher contrast than the other objects. Each cut-out measures 5″ × 5″. |
 |
Fig. C.8. Example cut-outs of Milky Way GCs added to the Euclid VIS image of IC 342. Each cut-out measures 5″ × 5″. |
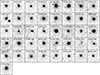 |
Fig. C.9. HST/ACS F606W cut-outs of the GC candidates in IC 342. Compared to Fig. C.2, these cut-outs are zoomed in by a factor of two. Each cut-out thus measures |

All Tables
All Figures
|
Fig. 1. PSF-corrected FWHM size as a function of IE magnitude for sources in the NGC 2403 field. Previously known GCs are shown with red filled circles while the new candidates identified in H25 are shown with open circles. Data for Milky Way GCs are also included, scaled to the distance of NGC 2403 (black filled circles). The red line indicates our size cut for the selection of cluster candidates. |
| In the text | |
|
Fig. 2. Simulated images of GCs added to the Euclid VIS image of NGC 2403, next to the clusters D6 (top), JC15 (centre), and a new candidate closer to the centre of NGC 2403 (bottom). In each panel, simulated GCs are shown for masses of 105 M⊙, 3 × 10⁵ M⊙, and 106 M⊙ (left to right) a half-light radius of 3 pc, and an assumed age of 10 Gyr. Each panel measures 295 × 70 VIS pixels ( |
| In the text | |
|
Fig. 3. Top and centre panels: As Fig. 2, but for IC 342. Bottom panel: Simulated clusters with the same masses, but for an age of 20 Myr. See text for details. |
| In the text | |
|
Fig. 4. Luminosity functions for simulated Milky Way GCs added to the Euclid images of IC 342. The distributions of input IE magnitudes are shown for all clusters added within the Euclid footprint (blue), those recovered in the VIS images (orange), and those that also have photometry in the NISP (black hatched) and MegaCam images (green circular-hatched). |
| In the text | |
|
Fig. 5. Input and measured colour-magnitude diagrams for artificial Milky Way GCs added to the IC 342 images. The horizontal dashed lines indicate our magnitude limit for selection of cluster candidates. |
| In the text | |
|
Fig. 6. Cut-out images of various sources in IC 342 that passed the magnitude- and size criteria, but were not classified as class 1–4 cluster candidates. Each cut-out measures 5″ × 5″. |
| In the text | |
|
Fig. 9. MegaCam Hα − r vs. (u − g)0 two-colour diagram for sources in IC 342. Symbols as in Fig. 7. The dashed line indicates our colour cut for selection of old GC candidates. |
| In the text | |
|
Fig. 7. Euclid CMDs. The grey dots show all sources in the master catalogue for each galaxy, while the open and filled blue circles are our new candidates classified as ‘possible’ or ‘likely’, respectively. For NGC 2403, the previously known GCs are shown in red. Formal uncertainties on the photometry are generally less than 0.01 mag, but see Sect. 4.3 for a detailed discussion of the uncertainties. |
| In the text | |
|
Fig. 8. PARSEC simple stellar population model colours versus age. Top: EuclidIE−{HE. Middle: MegaCam g − r. Bottom: MegaCam u − g. For the MegaCam filters, dashed and solid lines indicate models for the old and new MegaCam filters, respectively. The horizontal dashed lines indicate the colour criteria for selection of old GC candidates. |
| In the text | |
|
Fig. 10. EuclidIE vs. MegaCam (g − r)0 CMDs. For Holmberg II, the g − r photometry is from LBT. Symbols are the same as in Fig. 7. |
| In the text | |
|
Fig. 11. MegaCam-only two-colour diagrams. The coloured quadrants indicate the classification of our class 1–4 candidates as GC candidates (red), intermediate-age candidates (blue), or ambiguous (grey). Small grey points indicate sources classified as galaxies during the visual inspection. |
| In the text | |
|
Fig. 12. Comparison of sizes for GC candidates in IC 342 measured on the Euclid VIS images and on HST/ACS F606W images. |
| In the text | |
|
Fig. 13. Half-light radius as a function of M(IE) for star cluster candidates. In each panel, the corresponding data for Milky Way GCs are shown for reference. |
| In the text | |
|
Fig. 14. Cluster half-light radii versus projected galactocentric distance for globular and young clusters, compared with Milky Way GCs. The coloured lines show median values for the corresponding types of clusters in bins of 10. |
| In the text | |
|
Fig. 15. Luminosity functions of class 1–4 cluster candidates in each of the three galaxies, compared with the Milky Way GCLF. The dashed lines indicate the IE = 21.5 selection limits for the cluster candidates. |
| In the text | |
|
Fig. 16. Colour distributions of GC candidates in the three Showcase galaxies. Also included are data for spectroscopically confirmed GCs in the Fornax cluster (Saifollahi et al. 2025). |
| In the text | |
|
Fig. 17. Luminosity functions of young star cluster candidates. |
| In the text | |
|
Fig. B.1. Euclid VIS image of IC 342 with class 1–4 cluster candidates marked. Old GC candidates are shown with red circles, intermediate-age candidates in blue, and ambiguous candidates as open black circles. The dashed black circle indicates a radius of 10 kpc and the white/magenta dashed lines indicate the HST/ACS F435W+F606W coverage from programmes 10579 and 16002. North is up and east to the left. |
| In the text | |
|
Fig. B.2. Euclid VIS image of NGC 2403 with cluster candidates marked. Symbols and orientation of the image are as in Fig. B.1. Also indicated is a JWST/NIRCAM pointing from Programme ID 1638 (dashed blue lines). |
| In the text | |
|
Fig. B.3. Euclid VIS image of the central 400″ × 400″ around Holmberg II with cluster candidates marked. As in Fig. B.1, red and blue circles indicate our old GC and IAC candidates, respectively. Large magenta circles indicate young (class 10) objects and smaller magenta markers indicate clusters from the LEGUS survey (Cook et al. 2019). |
| In the text | |
|
Fig. C.1. Cut-outs of clusters in IC 342 classified as intermediate-age candidates based on their MegaCam colours. The ID of each cluster is indicated with the leading ‘ESCC’ stripped. Each cut-out measures 5″ × 5″. |
| In the text | |
|
Fig. C.2. Cut-outs of clusters in IC 342 classified as GC candidates based on their MegaCam colours. Each cut-out measures 5″ × 5″. |
| In the text | |
|
Fig. C.3. Cut-outs of clusters in IC 342 with ambiguous MegaCam colours. Each cut-out measures 5″ × 5″. |
| In the text | |
|
Fig. C.4. Cut-outs of intermediate-age cluster candidates in NGC 2403. Each cut-out measures 5″ × 5″. |
| In the text | |
|
Fig. C.5. Cut-outs of GC candidates in NGC 2403. Each cut-out measures 5″ × 5″. |
| In the text | |
|
Fig. C.6. Cut-outs of ambiguous cluster candidates in NGC 2403. Each cut-out measures 5″ × 5″. |
| In the text | |
|
Fig. C.7. Cut-outs of cluster candidates in Holmberg II. The objects HoII-001 and HoII-002 are shown at a higher contrast than the other objects. Each cut-out measures 5″ × 5″. |
| In the text | |
|
Fig. C.8. Example cut-outs of Milky Way GCs added to the Euclid VIS image of IC 342. Each cut-out measures 5″ × 5″. |
| In the text | |
|
Fig. C.9. HST/ACS F606W cut-outs of the GC candidates in IC 342. Compared to Fig. C.2, these cut-outs are zoomed in by a factor of two. Each cut-out thus measures |
| In the text | |
Current usage metrics show cumulative count of Article Views (full-text article views including HTML views, PDF and ePub downloads, according to the available data) and Abstracts Views on Vision4Press platform.
Data correspond to usage on the plateform after 2015. The current usage metrics is available 48-96 hours after online publication and is updated daily on week days.
Initial download of the metrics may take a while.