Fig. 10.
Download original image
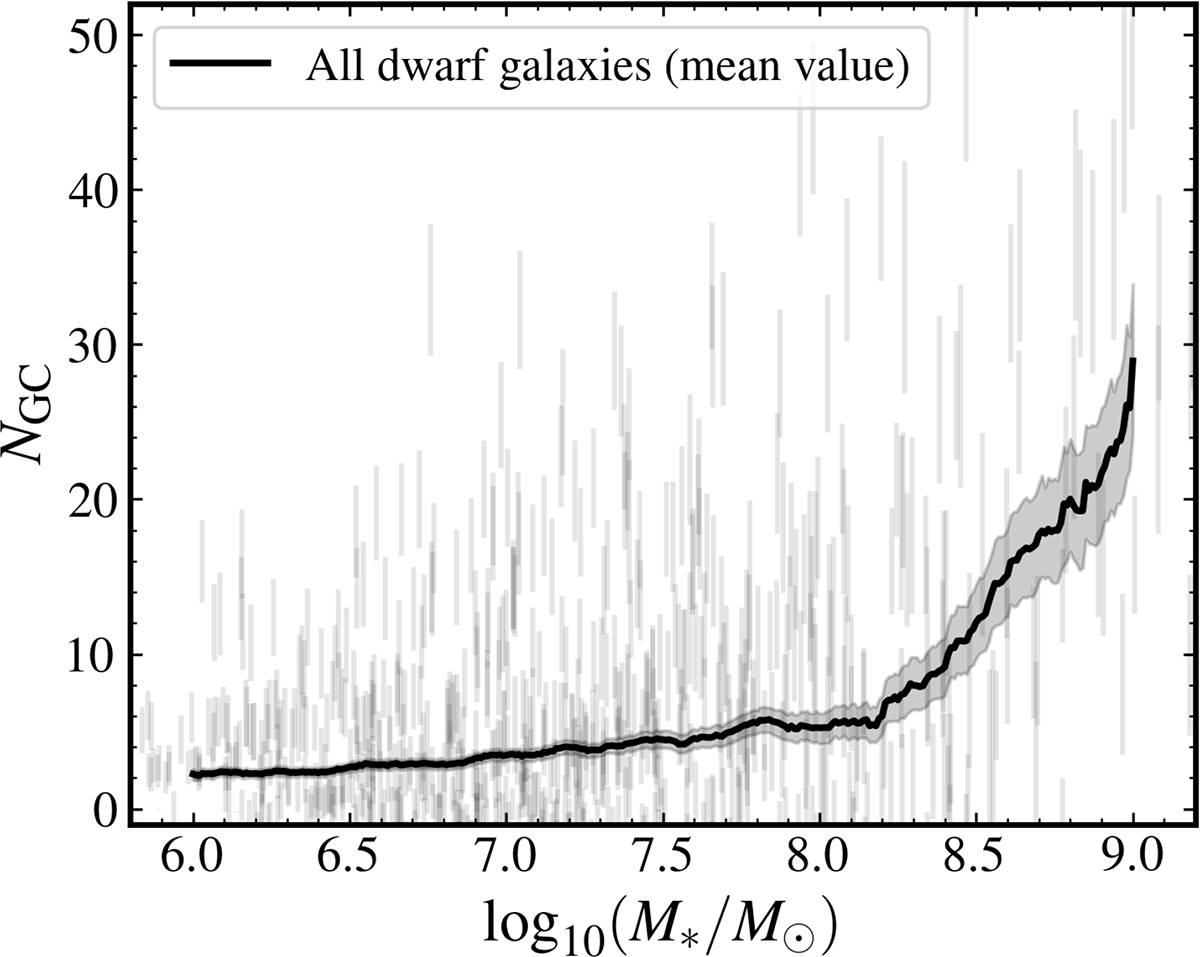
Total GC numbers (NGC) for all the dwarf galaxies in this work. The vertical (grey) lines represent the NGC and their uncertainties for individual dwarf galaxies. The solid curve and the shaded regions around it represent the average (mean) NGC and 68% confidence intervals for dwarf galaxies within a moving bin along stellar mass (x-axis) with a width of 0.5 dex. The confidence intervals are based on 1000 bootstrap-repetitions of the estimates using bootstrap sample sizes of 95% of the initial sample sizes.
Current usage metrics show cumulative count of Article Views (full-text article views including HTML views, PDF and ePub downloads, according to the available data) and Abstracts Views on Vision4Press platform.
Data correspond to usage on the plateform after 2015. The current usage metrics is available 48-96 hours after online publication and is updated daily on week days.
Initial download of the metrics may take a while.