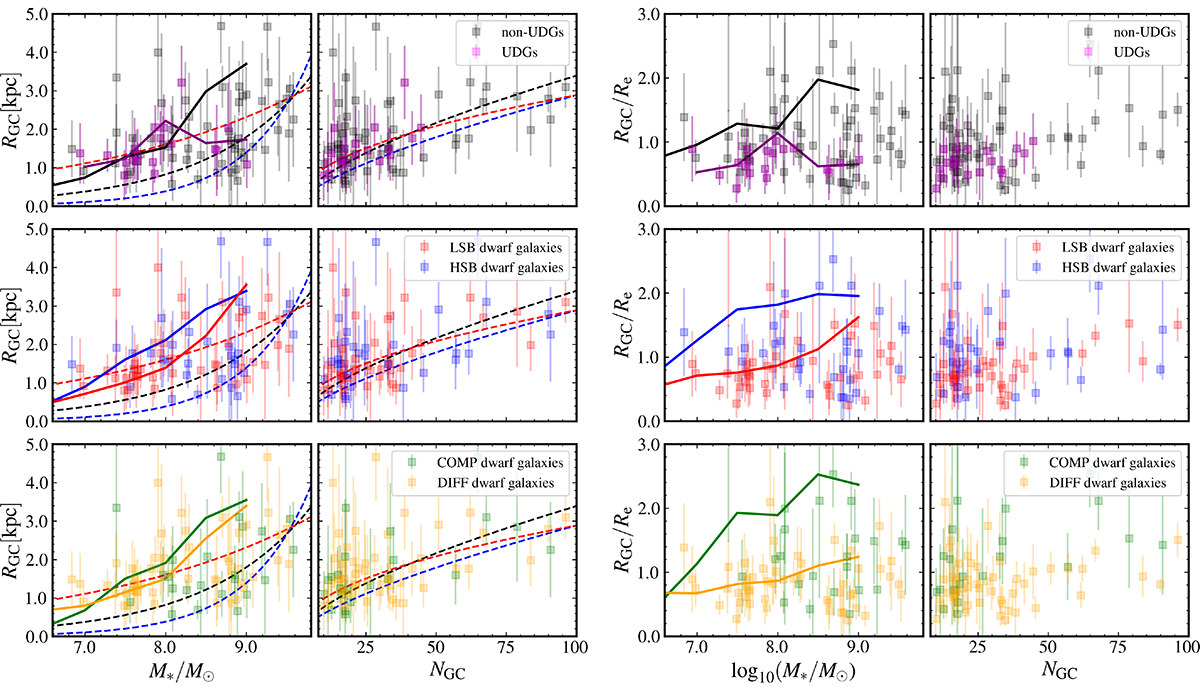
Fig. 14.
Download original image
Properties of the radial distributions of the GC systems of dwarf galaxies with NGC > 10. Panels on the left and right show RGC and RGC/Re values for different categories of dwarf galaxies versus their M* and NGC. The panels on the left also show the extrapolated equations from Lim et al. 2024 for all GCs (black dashed line), blue GCs (blue dashed line) and red GCs (red dashed line). We recall that these curves are our extrapolations of analytical expressions derived at higher galaxy masses into the low-mass regime. Solid lines show the results from the stacked GC distributions in Sect. 4.2 for each dwarf galaxy category. Therefore, these lines are not a fit on the presented data-points, but the curves presented previously in Fig. 8.
Current usage metrics show cumulative count of Article Views (full-text article views including HTML views, PDF and ePub downloads, according to the available data) and Abstracts Views on Vision4Press platform.
Data correspond to usage on the plateform after 2015. The current usage metrics is available 48-96 hours after online publication and is updated daily on week days.
Initial download of the metrics may take a while.