Open Access
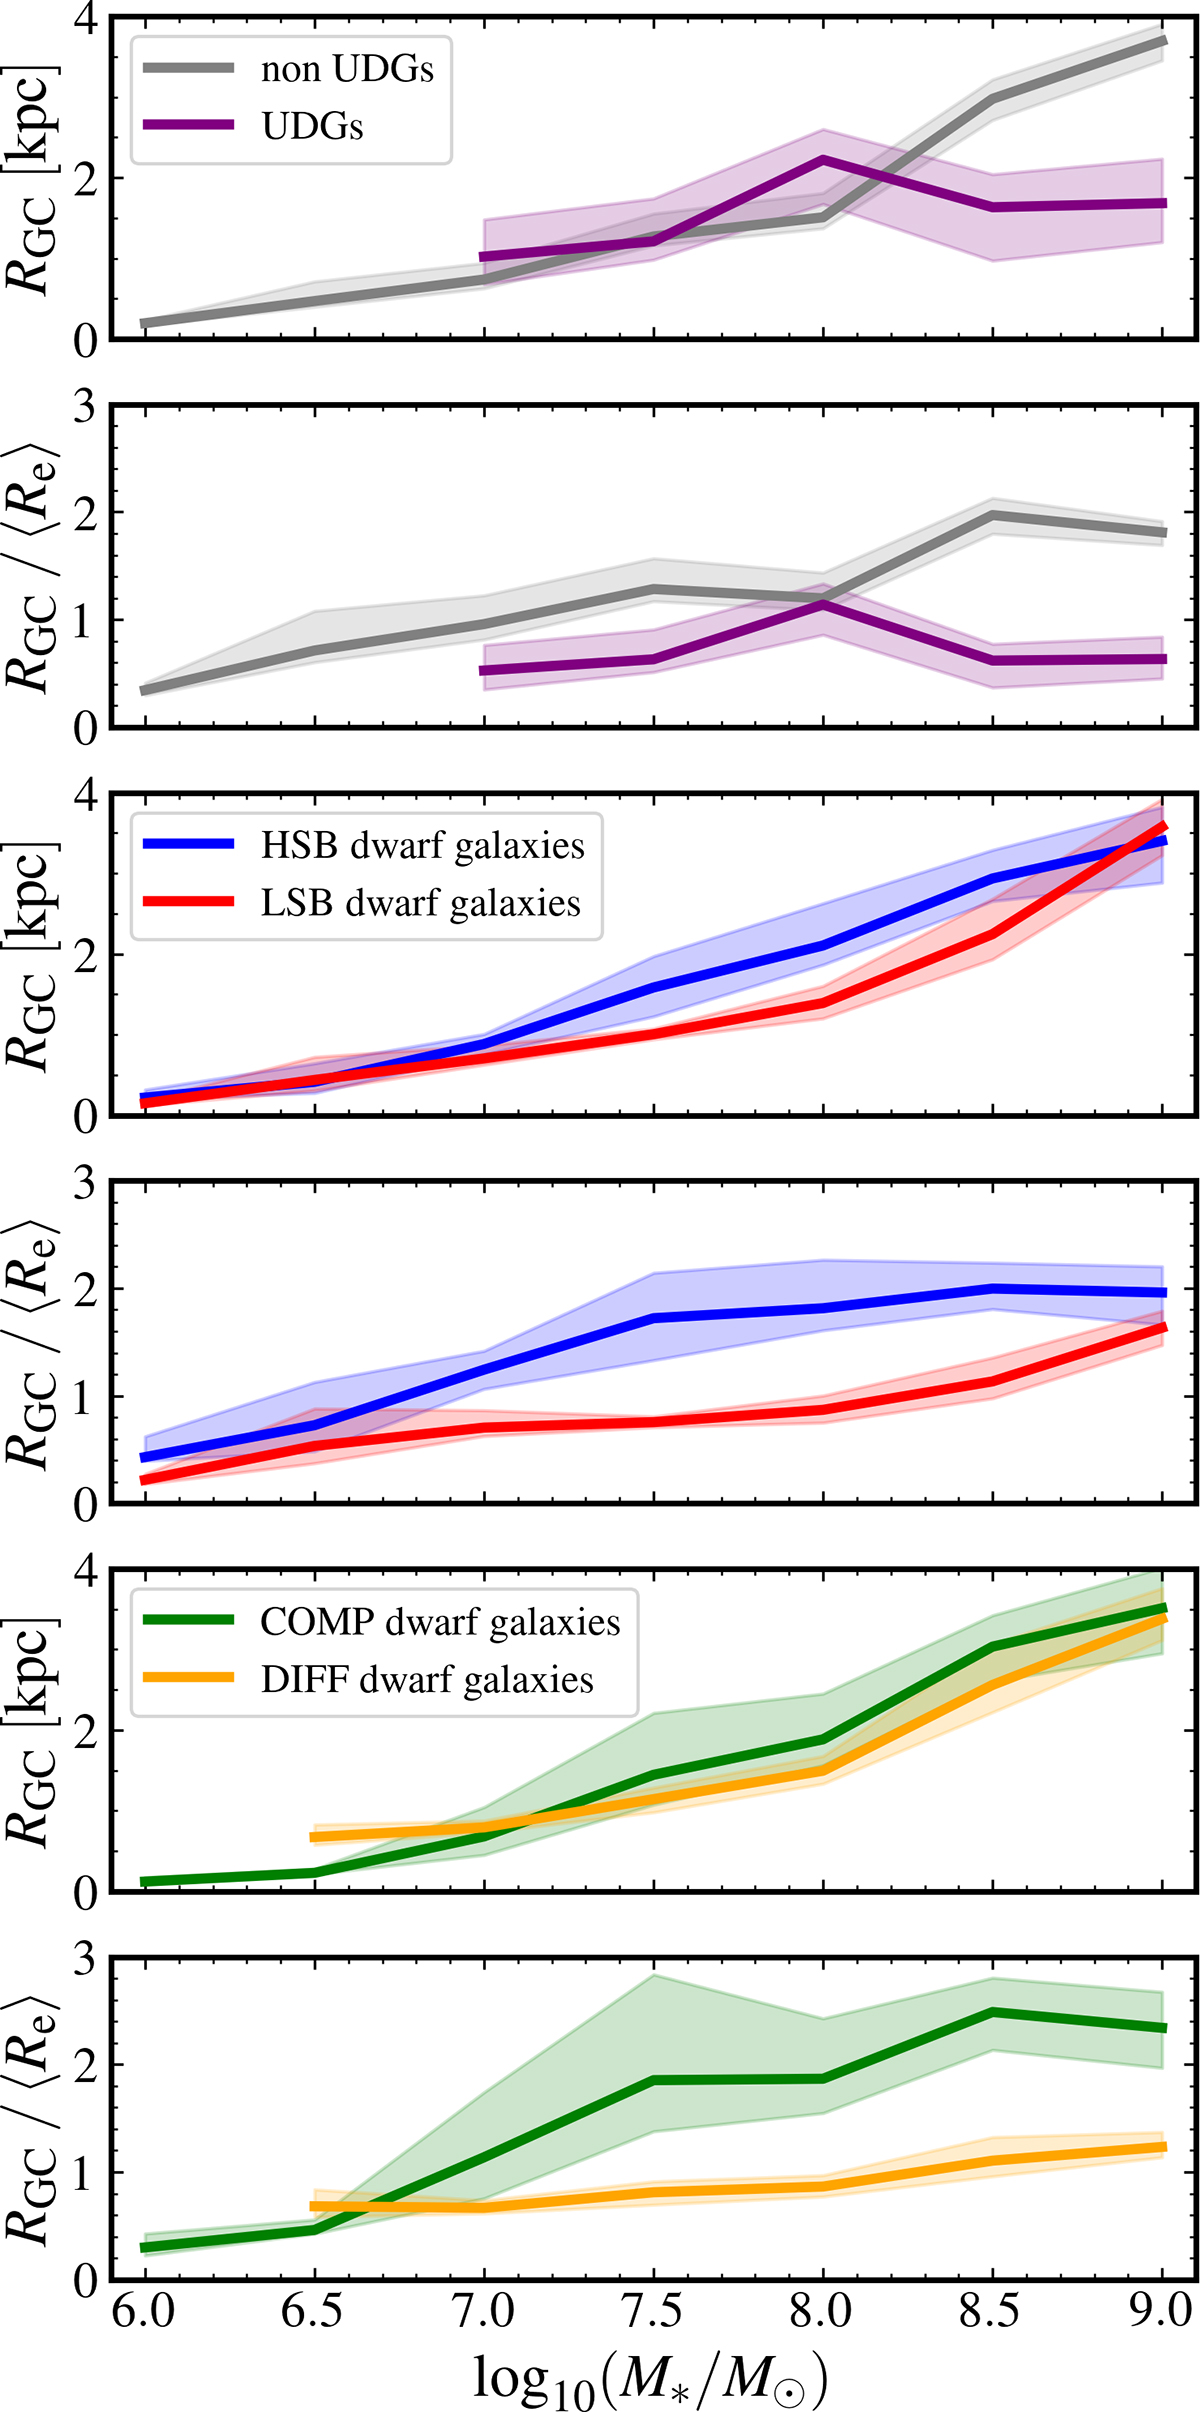
Fig. 8.
Download original image
Similar to Fig. 7 but for different dwarf galaxy categories. The two top panels represent the estimations for UDGs and non-UDGs (in purple and grey), the two middle panels are for those of LSBs and HSBs (in red and blue), and the bottom two panels are for DIFFs and COMPs (in yellow and green).
Current usage metrics show cumulative count of Article Views (full-text article views including HTML views, PDF and ePub downloads, according to the available data) and Abstracts Views on Vision4Press platform.
Data correspond to usage on the plateform after 2015. The current usage metrics is available 48-96 hours after online publication and is updated daily on week days.
Initial download of the metrics may take a while.