Open Access
Fig. A.1.
Download original image
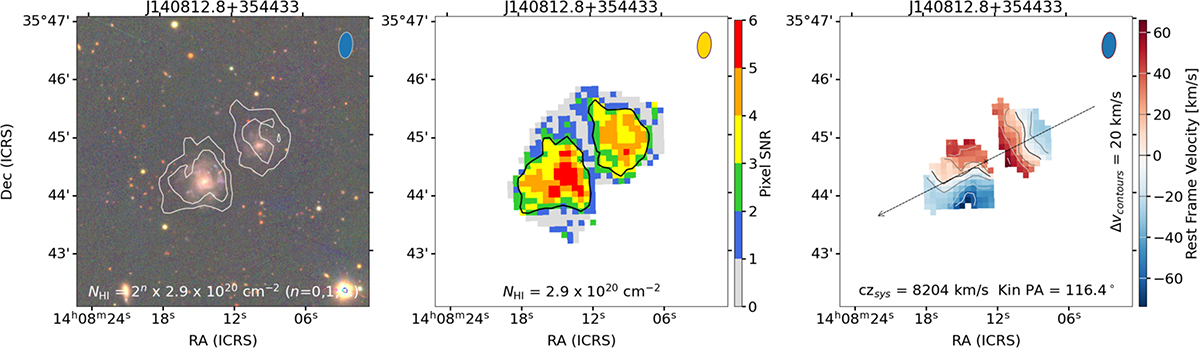
AHCJ140812.8+354433 as an example of a clear merged detection with two distinct optical counterparts within a well-resolved H I detection. Left: PanSTARRS1 color image overlaid with H I contours. Middle: S/N map of the H I detection. Right: Velocity field of the H I detection. All panels are obtained from the output of SIP.
Current usage metrics show cumulative count of Article Views (full-text article views including HTML views, PDF and ePub downloads, according to the available data) and Abstracts Views on Vision4Press platform.
Data correspond to usage on the plateform after 2015. The current usage metrics is available 48-96 hours after online publication and is updated daily on week days.
Initial download of the metrics may take a while.