Fig. 2.
Download original image
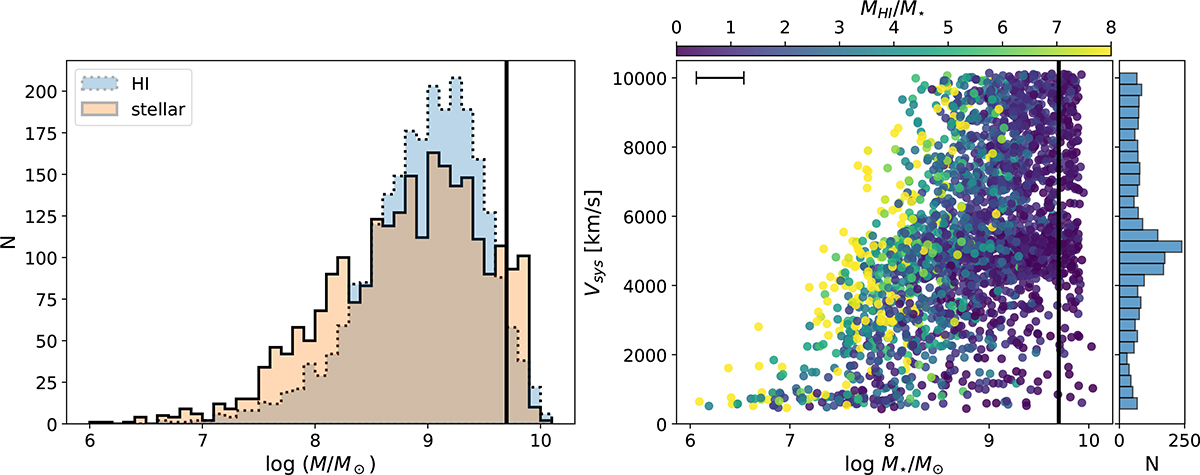
Properties of the parent dwarf galaxy sample. Left: histograms of H I (blue) and stellar (orange) masses of the sample. The vertical line denotes the dwarf stellar mass limit of 5 × 10⁹ M⊙. Right: systemic velocity vs. stellar mass of dwarfs in the sample, color-coded by the gas fraction. We show typical stellar mass error in the upper left corner. The vertical line is the same as in the left plot. On the right, we plot the histogram along the Vsys axis of our sample.
Current usage metrics show cumulative count of Article Views (full-text article views including HTML views, PDF and ePub downloads, according to the available data) and Abstracts Views on Vision4Press platform.
Data correspond to usage on the plateform after 2015. The current usage metrics is available 48-96 hours after online publication and is updated daily on week days.
Initial download of the metrics may take a while.